


In Case You Missed It: I was on Schwab Network yesterday, chatting with Oliver Renick about Retail Sales, Employment Data and the overall health of the economy. As you know, it is not a pretty picture when looking at real activity. It impacts the Weight of the Evidence and will influence how the market interprets any forthcoming action from the Fed.
Key Takeaway: Both the ride and the returns improve when we set aside fear and take time to be out of the market.
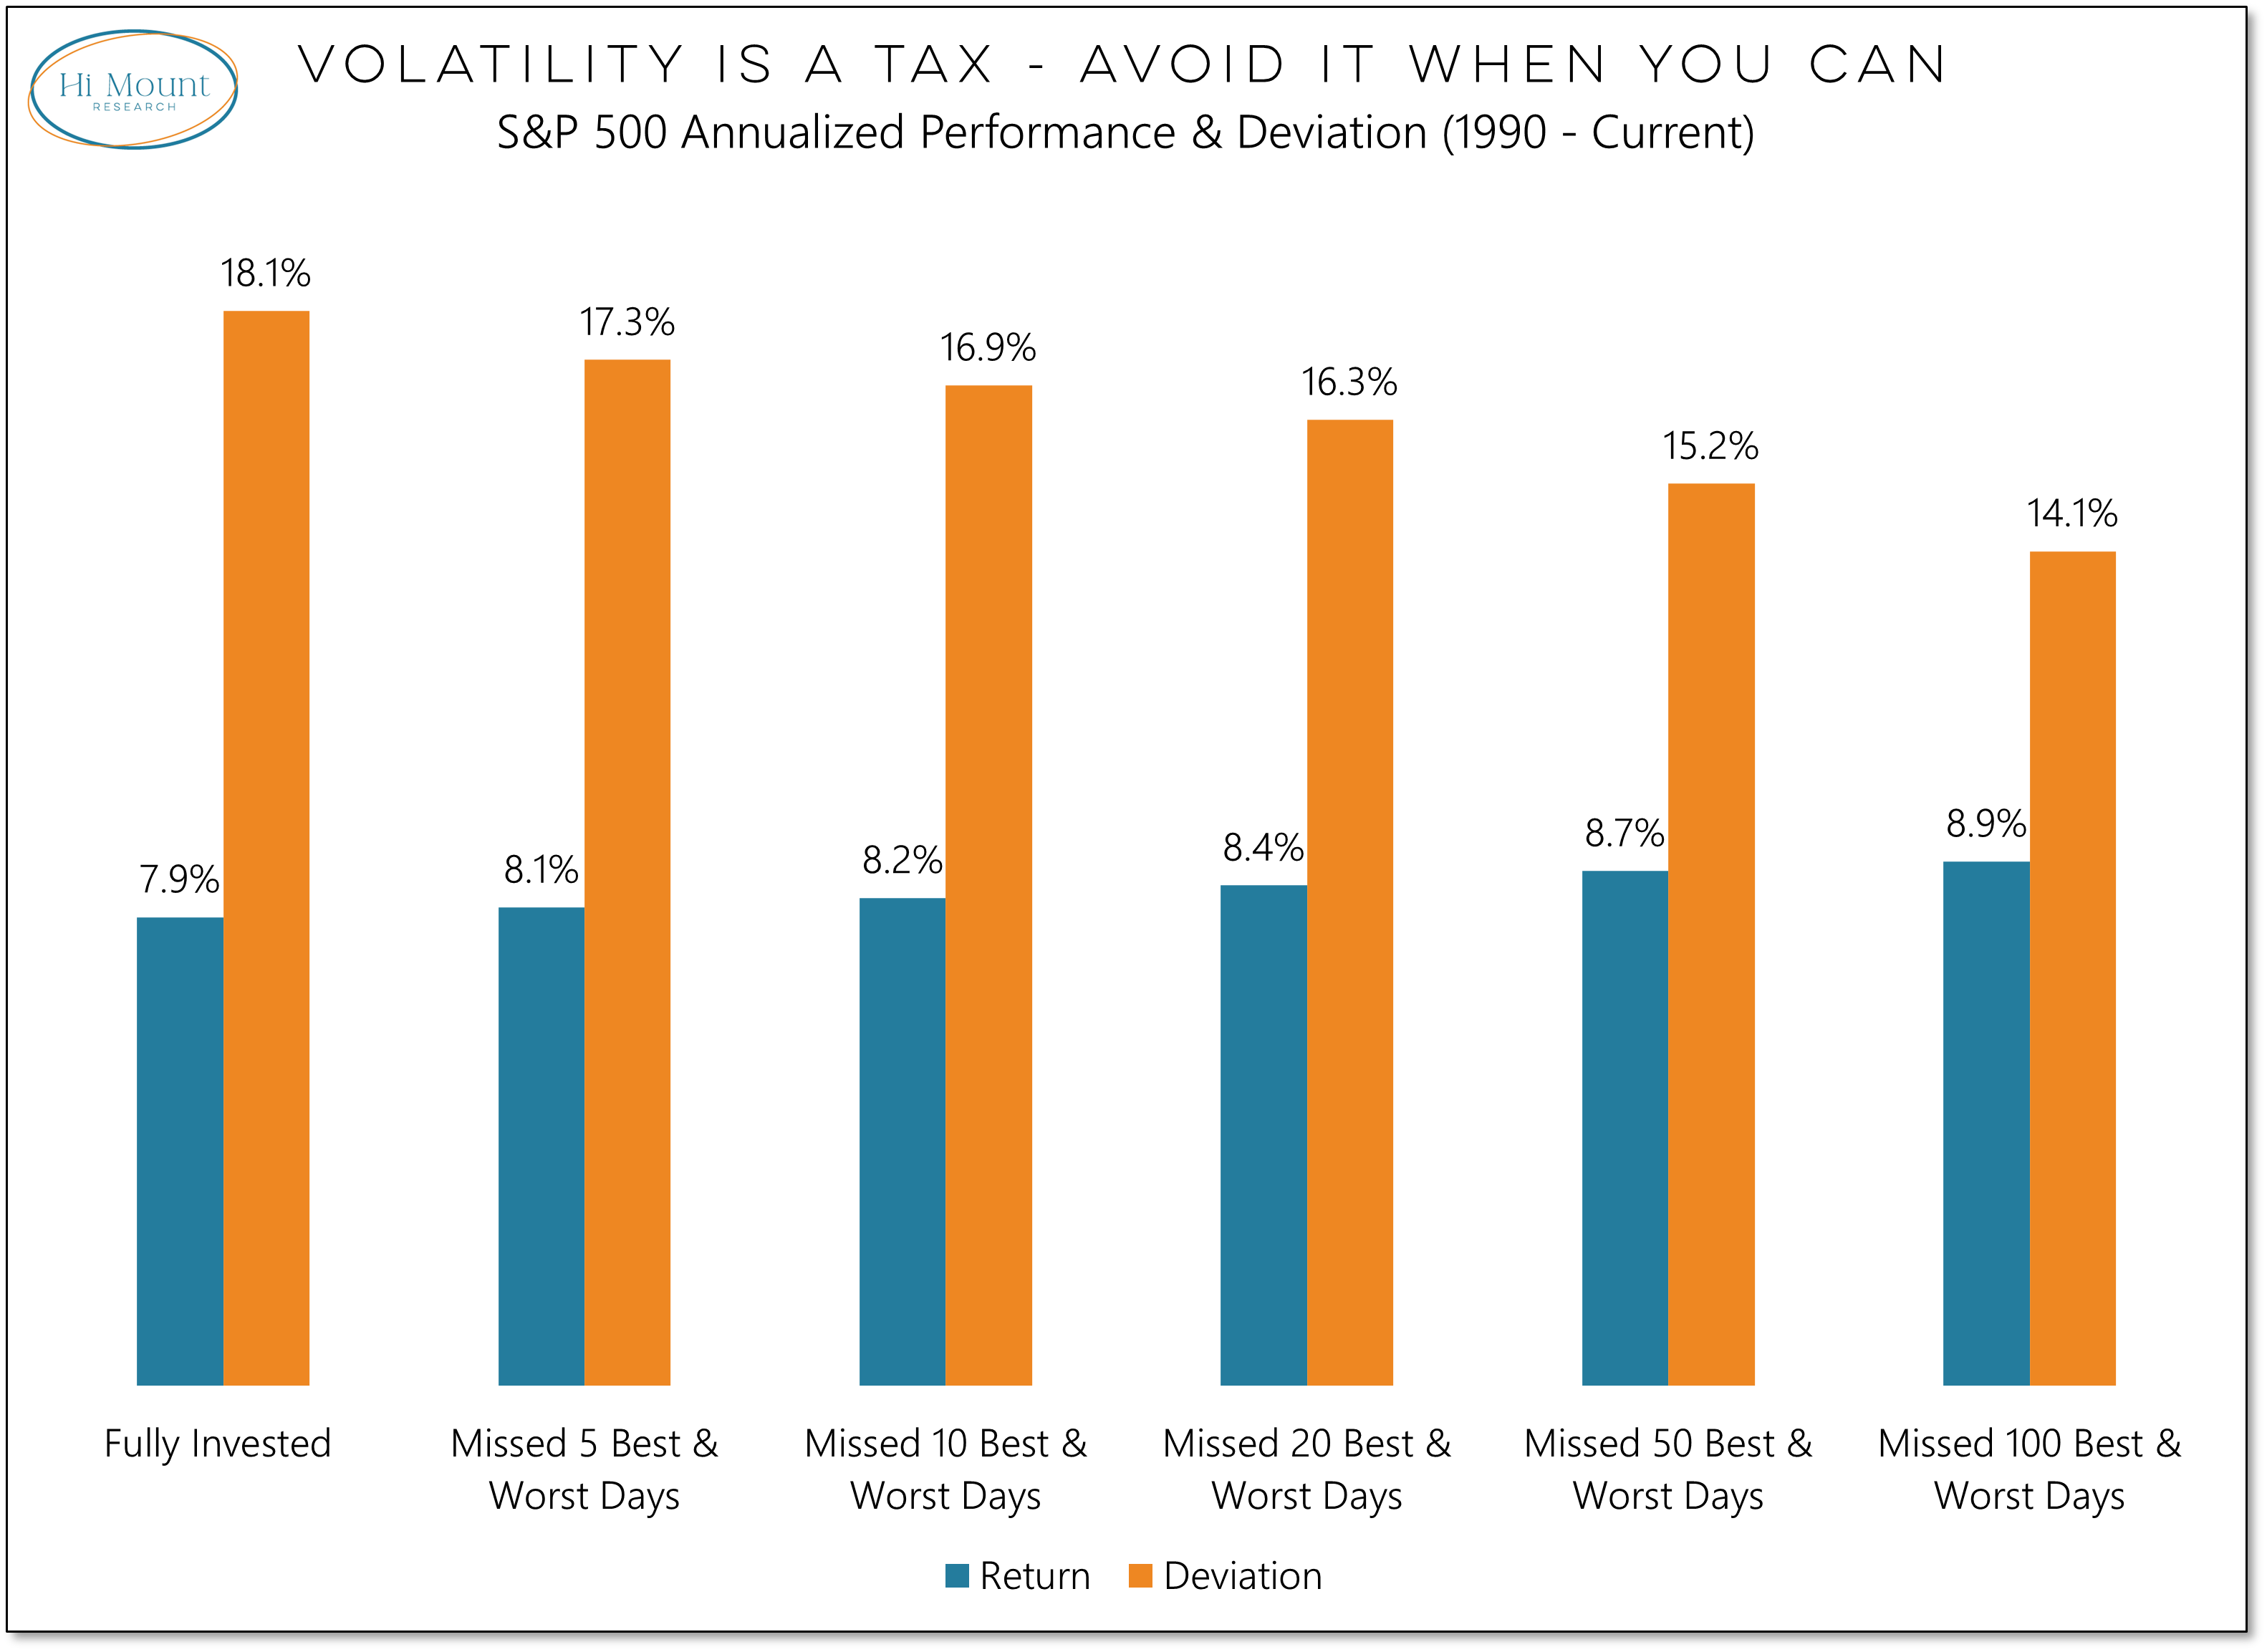
The “Time in the Market vs Timing the Market” charts are making the rounds again. Depending on the parameters that are used (starting date, # of days excluded) the actual numbers can vary, but they usually look something like this:

They are often put together by the Marketing departments of Wall Street firms to induce a little fear of missing out and thereby keeping investors sitting on their hands through the ups and downs of a market cycle.
The arithmetic used to produce these charts is sound. If you miss too many of the best days in the market (but stick around for the worst days) your cumulative gains evaporate rather quickly. On the other hand, if you sidestep just the worst days but fully participate in the best days, your cumulative gains soar. Remove the 50 best days from the market since 1990 and the annualized return is negative. Remove the 50 worst days and the annualized return more than doubles.

The market logic of just missing the best days (or just missing the worst days) is faulty. No one is so perfectly bad or so perfectly good at reading the environment that they will be missing out on just the best days or avoiding just the worst days. We do, however, know that the best days and the worst days often cluster together in periods of elevated volatility. So, if we are missing some of the best days, we are probably also missing some of the worst days.
The marketing departments for the big firms won’t tell you this, but I will: missing equal numbers of the best days and worst days will tend to increase returns and reduce overall volatility. The more volatility you miss, the better the investing experience. That means both a smoother ride and a better destination.
While that is a market fact, it is not an implementable strategy. But we know that these best day/worst day clusters are not random. They occur during periods of elevated volatility and those tend to occur during downtrends in the market. Increasing equity exposure during periods of trend strength (e.g. when the 200-day average is rising) and reducing equity exposure during periods of trend weakness (e.g. when the 200-day average is falling) is an implementable strategy and achieves the goal of largely sidestepping both the best and worst days in the market.

When we let go of the fear of missing out and embrace the longer-term trends, we can avoid volatility and sleep better at night, whether we are spending our time in the market or out of the market.