

A Little More Noise. A Lot More Volatility
Price trends are rising, investors remain hopeful, and the bull market gets the benefit of the doubt

Key Takeaway: The quiet glide higher of the first half has been replaced with a bumpier ride in the second half. That alone doesn’t need to spell the end of the bull cycle for stocks.
Monday’s sell-off was notable for the size of the decline and the associated surge in volatility (which produced a buy signal for our VIX model). It was also the third day in a row for which more stocks were down than up on the S&P 500. That was the first time since April that we had seen broad market weakness last more than two days in a row.

That ended one of the longest streaks without more than two consecutive days of weakness that we have experienced in the past quarter century. Whether we blame it on the Fed or the Yen, the fact is that the quiet calm of the first half of the year has now faded.

That streak of quiet calm has been replaced with noisy volatility. The S&P 500 has now moved 1% or more for five straight days. Starting yesterday and working backwards we have seen daily price swings of +1.0%, -3.0%, -1.8%, -1.4% and +1.6%). A 1% move today (the S&P 500 is up 1.5% as I write this) would run that streak to 6 days and it would be the longest such streak in nearly 4 years.

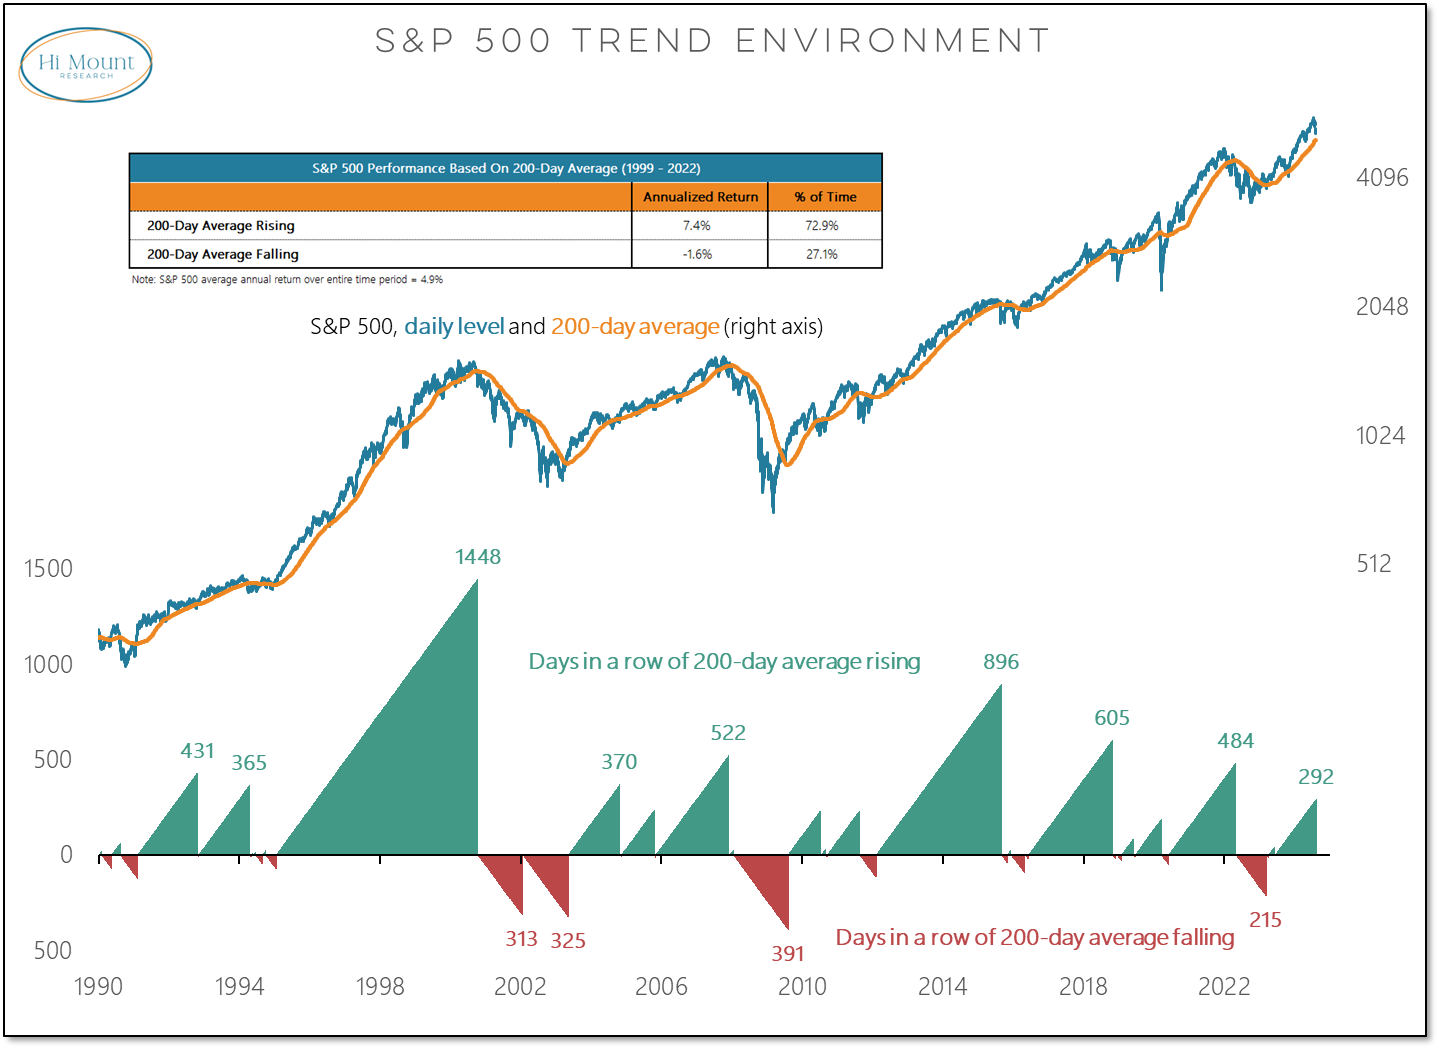
As the title of the chart above notes, bull markets tend to build on quiet strength. While the risk environment has shifted, market noise by itself does not signal the beginning of a bear market (though it can point to the beginning of the end of a bull move).
While the past few weeks have seen the ending of favorable streaks and beginning of less desirable streaks, there is a more important streak that has persisted. The 200-day average for the S&P 500 continues to rise (292 days in a row and still counting). The uptrend is still intact and that is a consistent sign of bull market behavior (all the net gains for the S&P 500 over the past 25 years have come when the 200-day average has been rising).
The degree of downside volume that accompanied Monday’s decline (the most in over a year) could be an early warning sign that the trend is shifting. A more conclusive signal would be a second 9-to-1 downside volume day without first experiencing a 9-to-1 upside volume day.

Three other market factors bear close attention right now:
Keep reading with a 7-day free trial
Subscribe to Hi Mount Research to keep reading this post and get 7 days of free access to the full post archives.