

Valuations Don't Matter Until They Do
Stocks are rallying but valuation headwinds remain on the horizon

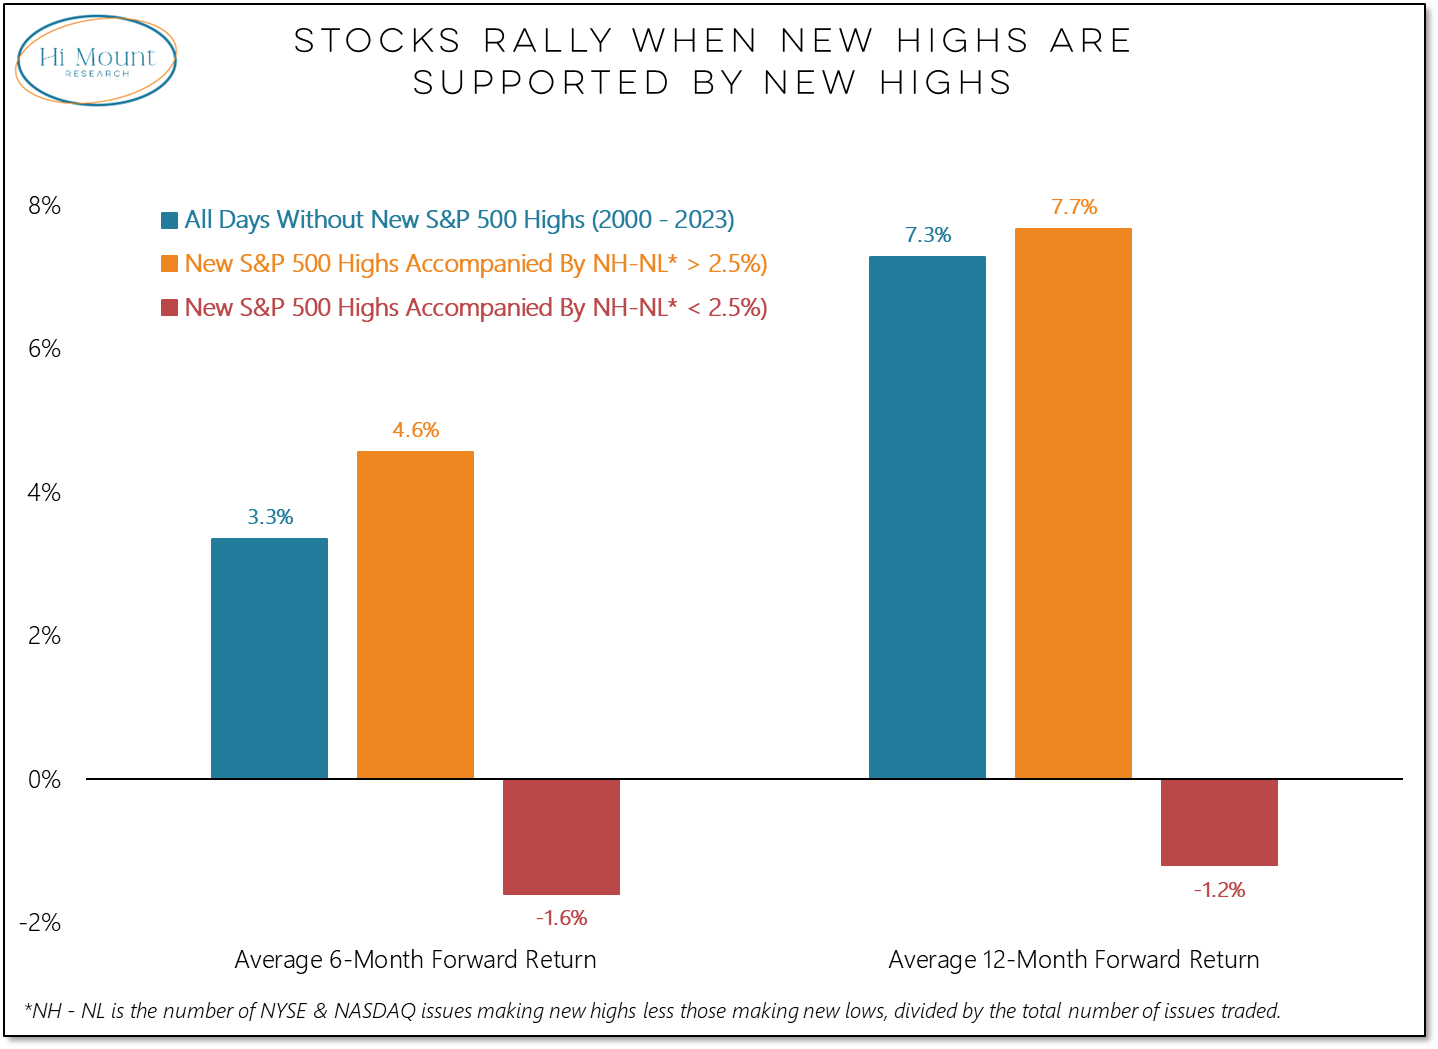
The S&P 500 made a new high last week, as did a host of other stock market indexes in the US and around the world. On a net (new highs less new lows) basis, 5.9% of individual stocks joined the indexes in making new highs. This was not elevated by historical standards it was extensive enough to avoid a caution flag that gets raised when a new high at the index-level is not supported by ample new highs beneath the surface.
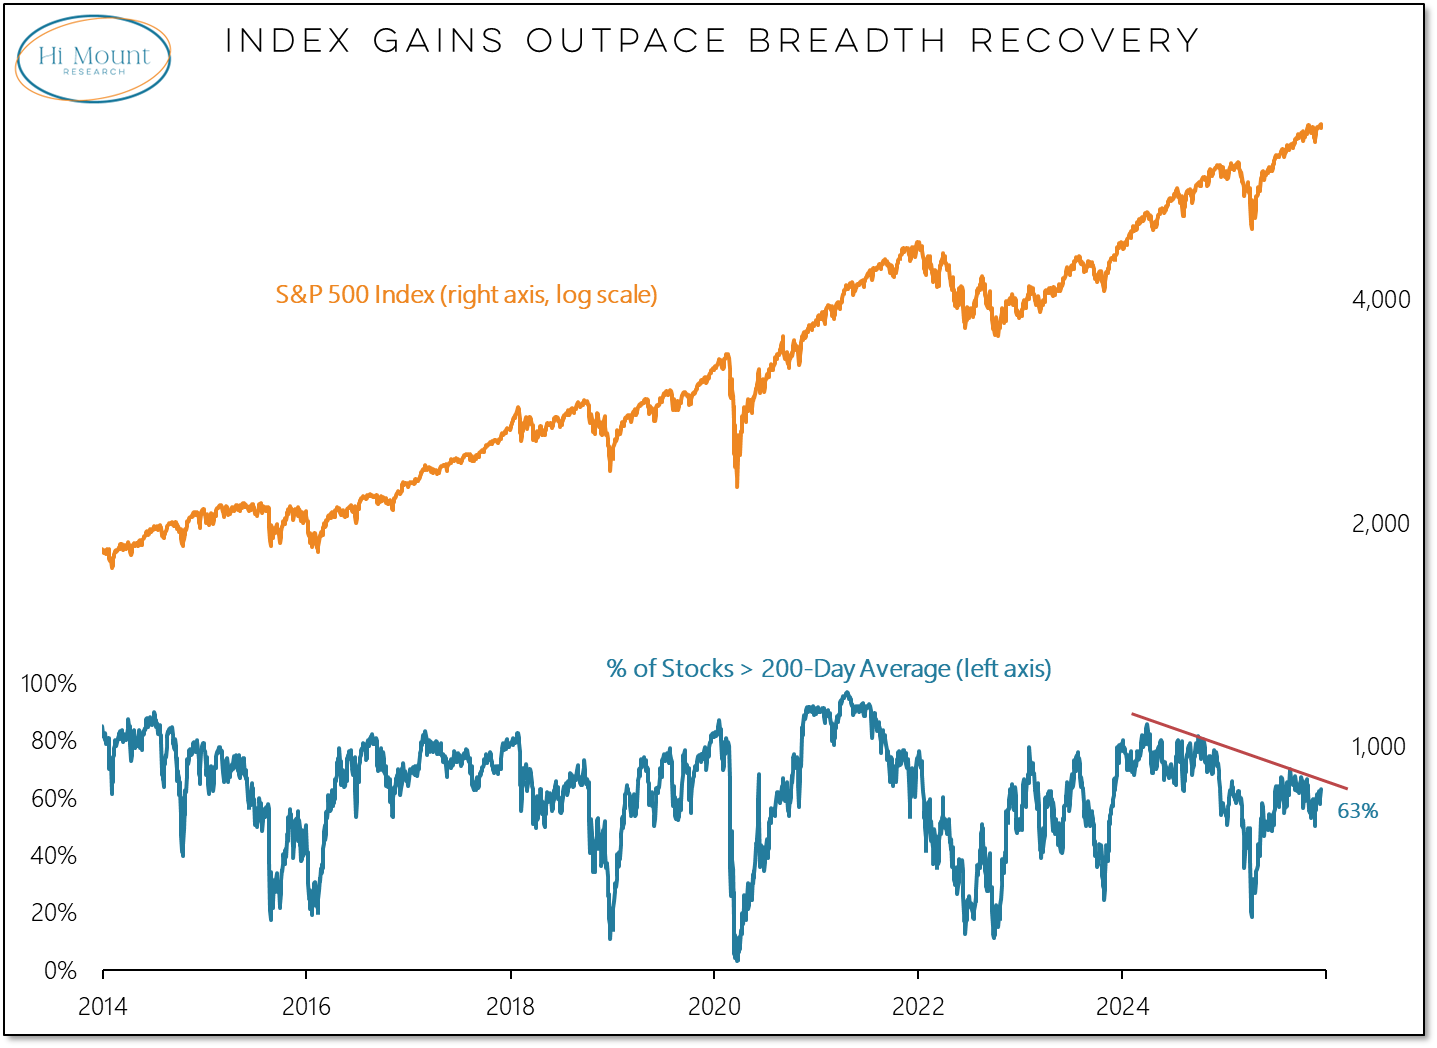
While the number of stocks making new highs is supportive of further index-level gains, the number of stocks trading above their 200-day average peaked in early 2024 and has been out of gear with the index since. Clearing up this divergence would be a feather in the cap for bulls and could signal a period where the index is led from the bottom up rather than the top down. New highs last week from mid-caps, small-caps and the equal-weight S&P 500 suggest this transition may indeed be in the works.
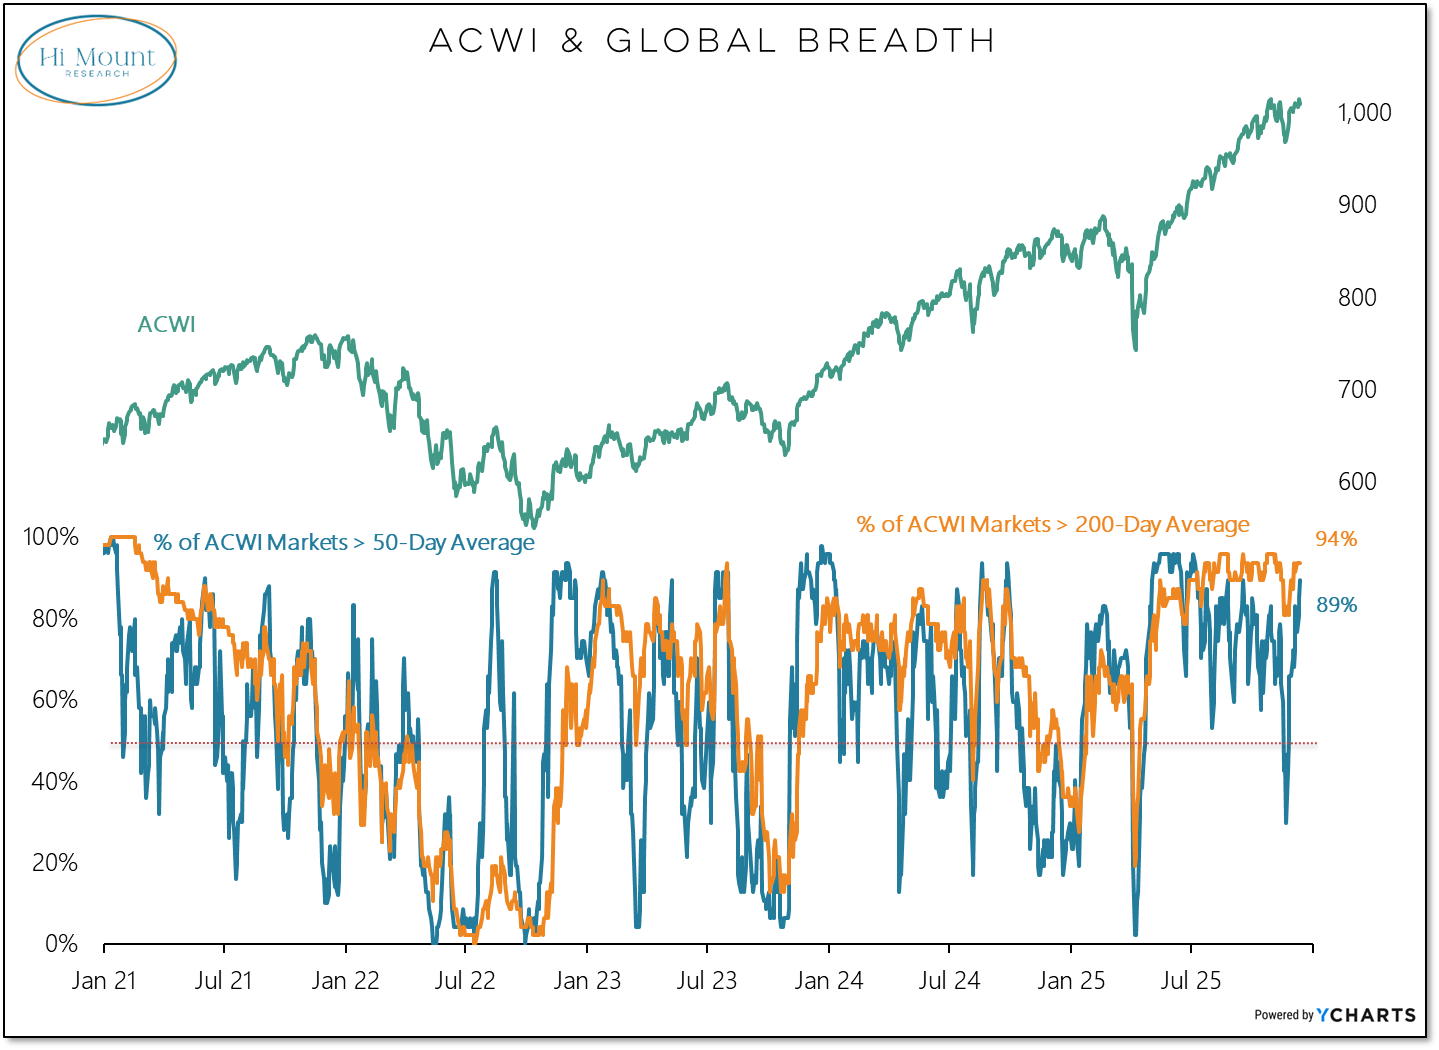
When we look around the world, we see that the percentage of ACWI markets trading above their 200-day averages has remained elevated and is currently in the mid 90’s. Persistent strength from a longer-term perspective has helped buoy shorter-term prospects and supported the recent recovery in the percentage of ACWI markets trading above their 50-day averages. Last month it was below 30% and last week it was approaching 90% and matching its highest level since mid-year.
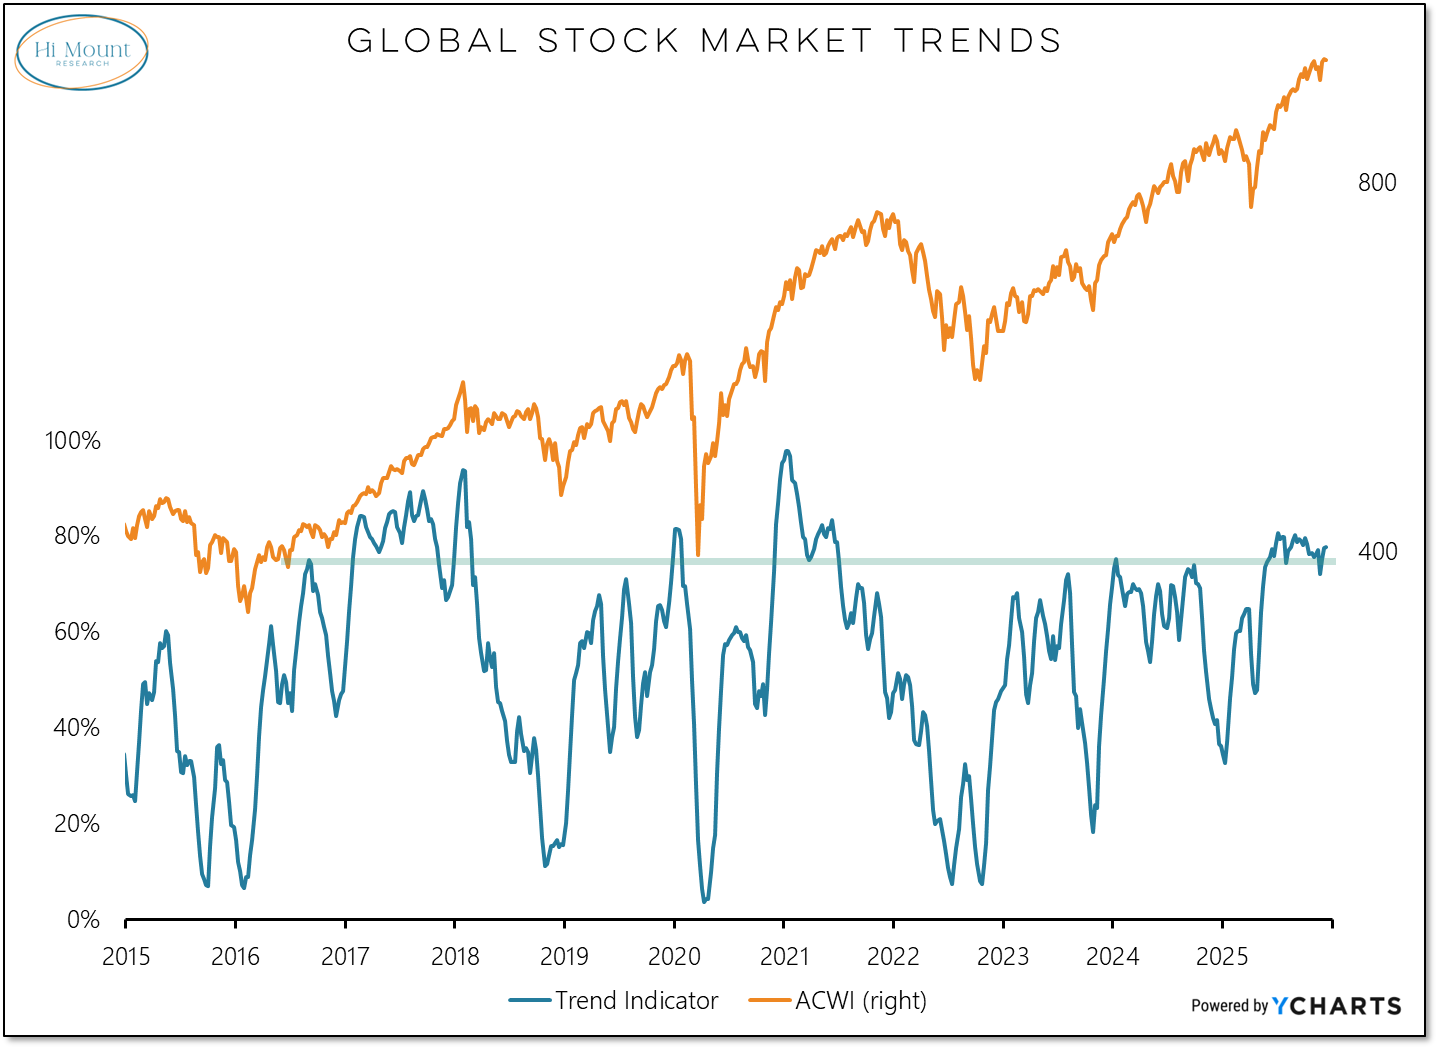
Trends have been stronger and participation broader around the globe than in the US for most of this year. Global trend strength in the latter part of 2205 has been reminiscent of the experience of 2017 and 2021. The lesson from the past is that market risks increase after these longer-term trends start to break down.
The US has been a middle-of-the-pack runner all year (and remains so in our latest Relative Strength Rankings). The rest of the world (ACWI ex-US) is now 41 weeks into a cyclical uptrend versus the US that is challenging the 15-year old secular trend favoring the US.
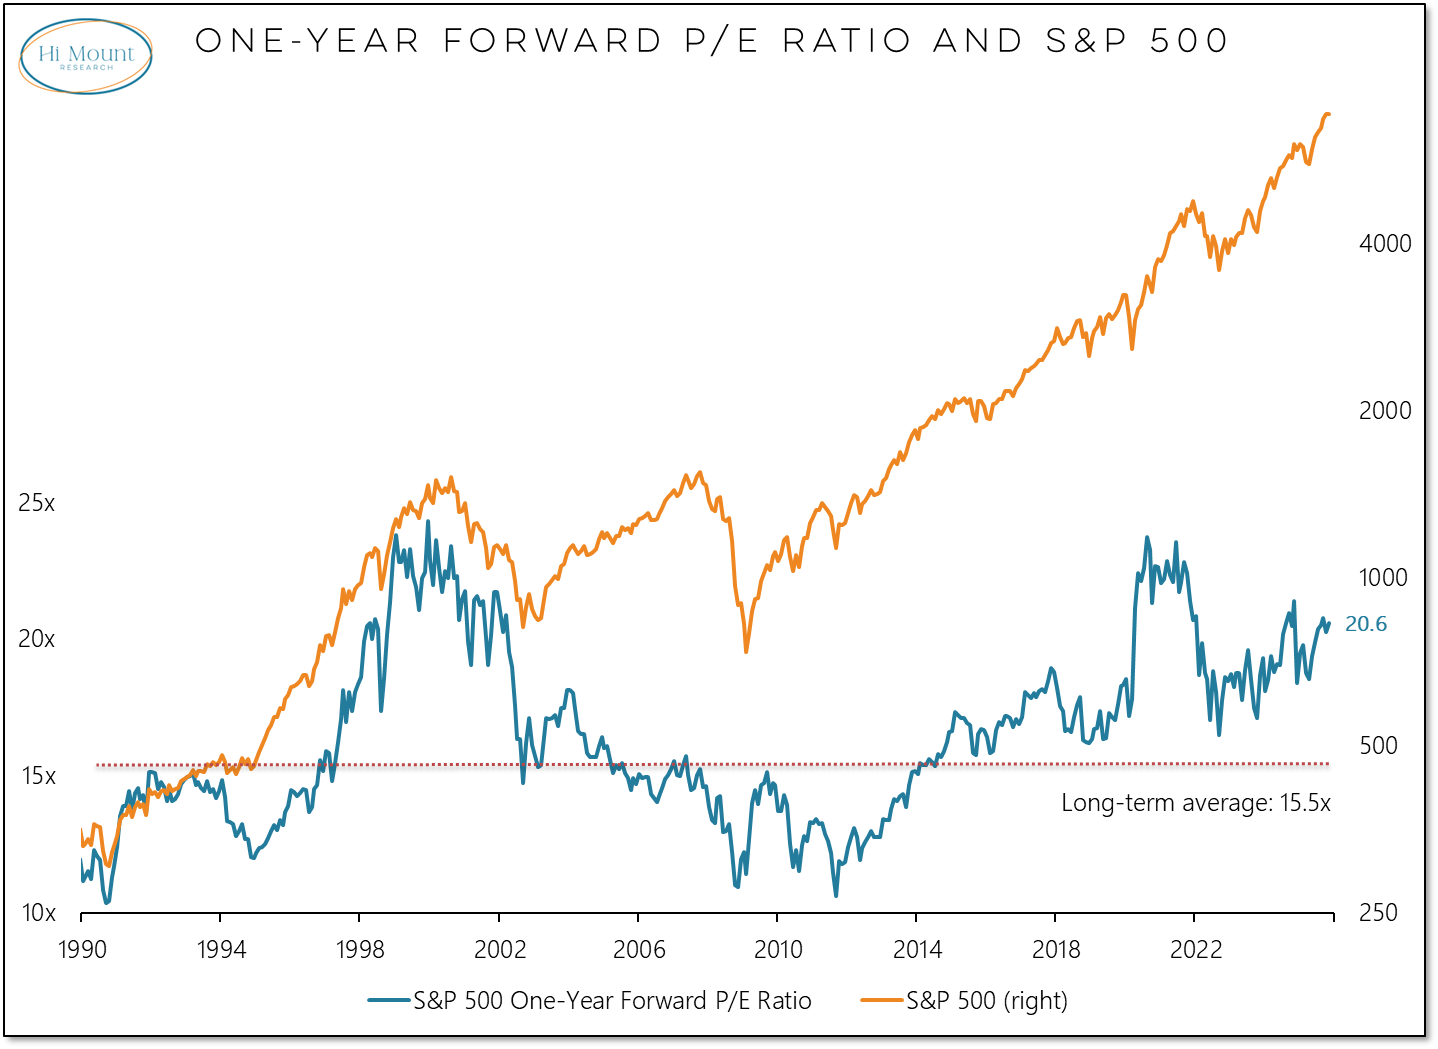
While US stocks may be losing leadership, they continue to trade at an elevated multiple relative to expected earnings. The forward P/E ratio for the S&P 500 is above 20x, not a historical high but certainly elevated versus the long-term average near 15x.
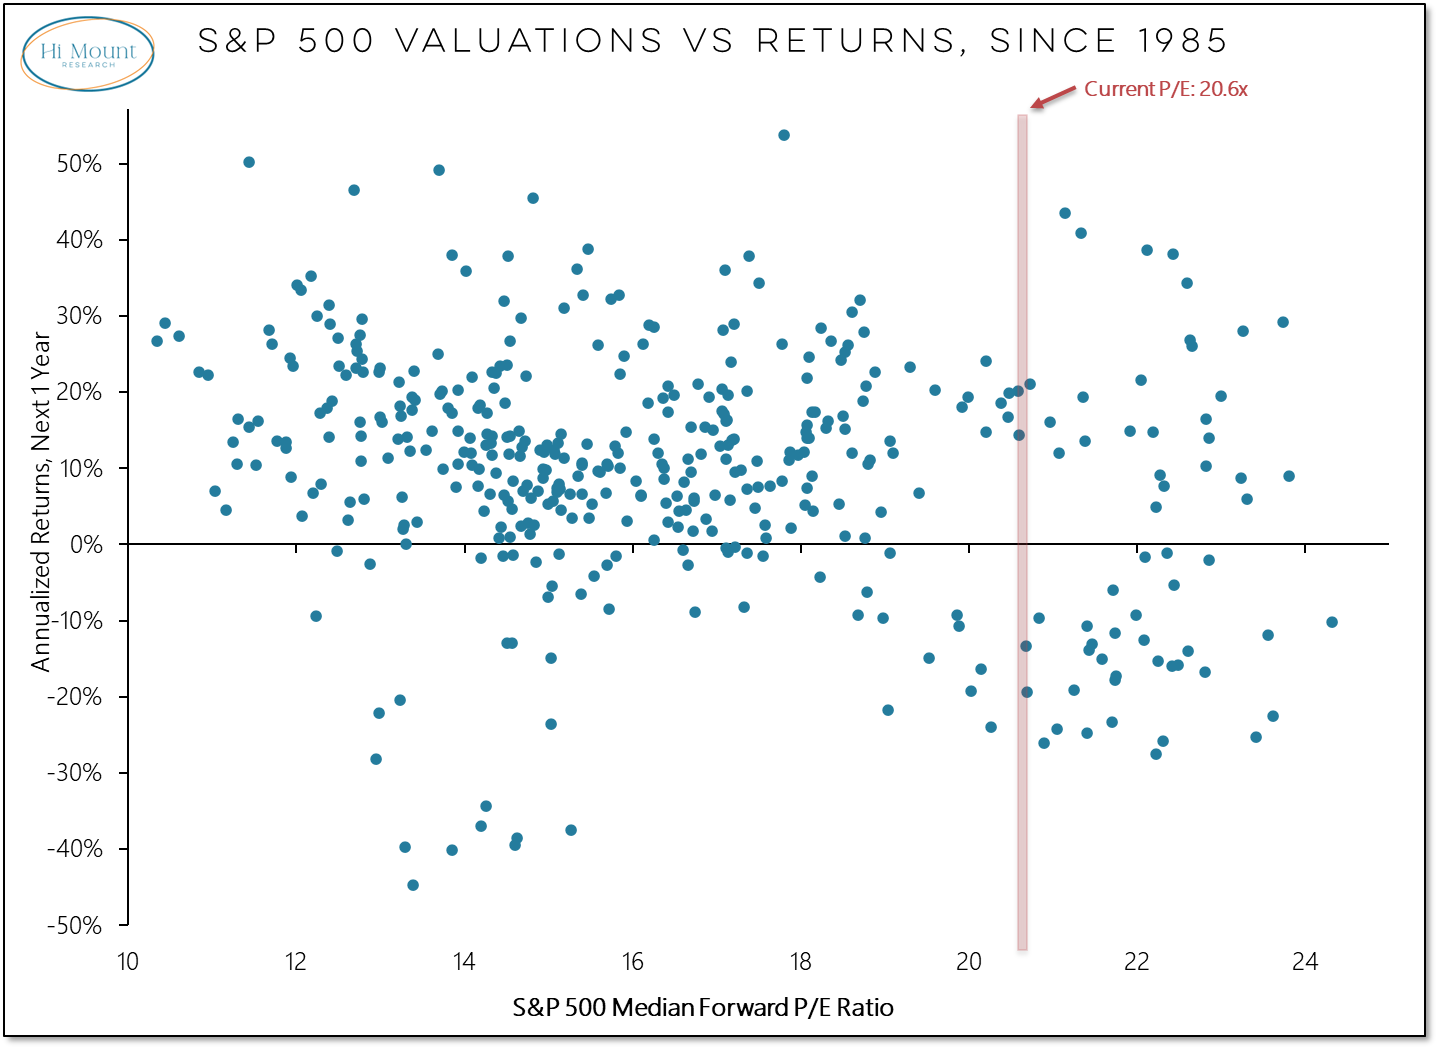
Valuations are not great guide for where for where the market could be headed over the coming year. Stocks that are cheap can get cheaper, stocks that are expensive, can remain so for uncomfortably long periods of time. To quote J.M. Keynes, “the market can stay irrational longer than you can stay solvent.” The scatterplot showing the relationship between the S&P 500’s forward P/E ratio and the market’s return over the following year is a shapeless cloud largely devoid of meaning.
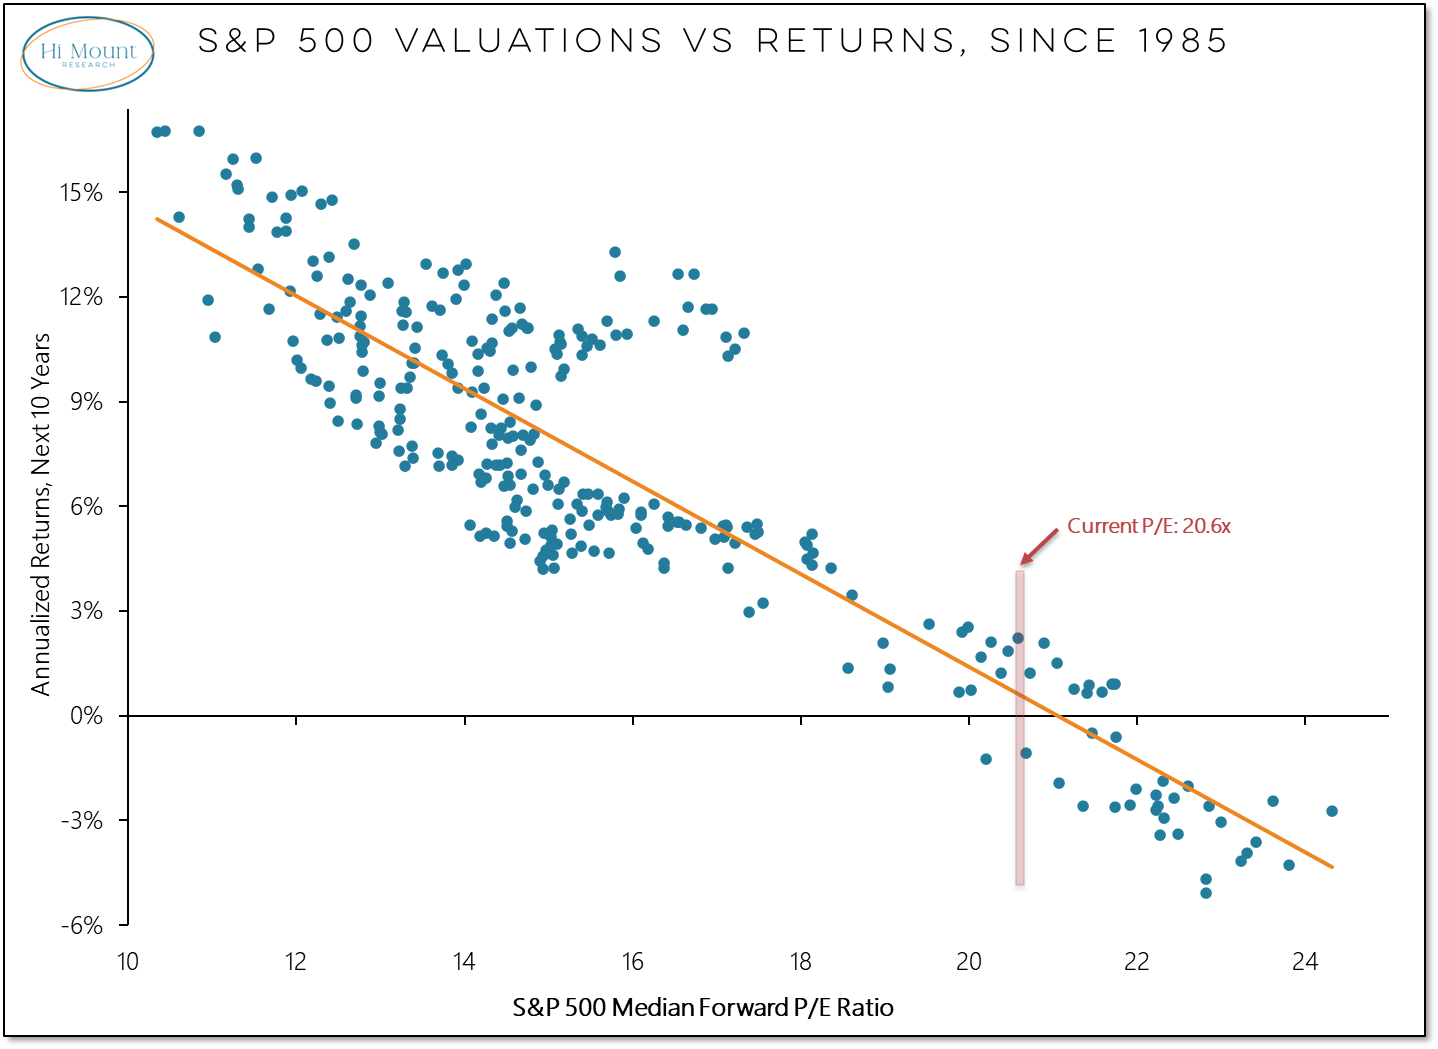
Valuations can be one of the most important gauges for considering potential risks and rewards over the longer-term. The scatterplot cloud coalesces around a trendline when we extend our time horizon. The inverse relationship between starting P/E ratio and annualized returns over the next decade is a stark reminder that the risks and returns in stocks over the next 10 years are unlikely to match the experience of the past 10 years. Only 9 out of the 344 (<3%) months with positive forward 10-year returns have had a starting valuations higher than we are now (and even then the returns barely kept up with inflation). Of the 28 months with negative forward 10-year returns, only a single on had a P/E ratio lower than the current level.
How and when these valuation risks manifest into periods of acute market stress remains to be seen. But history suggests a question of when not if.
Thanks for reading. Blessings on your week. -Willie