


US Weighing on the World
It was a rough week for US assets, but beyond our borders, stocks are holding up just fine for now

Treasury yields surged last week, and the foreign exchange value of the US Dollar sank (falling 2% and posting its lowest weekly close in more than 3 years). US equities came under similar pressure – the Value Line Geometric Index fell 3.5% and the S&P 500 was down 2.6%. It was the worst week for US stocks since the 9% decline in the first week of April. Weakness in the US weighed on the ACWI (All-Country World Index), which fell 1.4% last week and has failed to reclaim its February peak. But as has been the case all year, turbulence in the US, did little to disrupt the strength seen beyond our borders. Last week’s weakness pushed the S&P 500 back into negative territory on a YTD basis while the ACWI ex US is up double-digits so far in 2025.
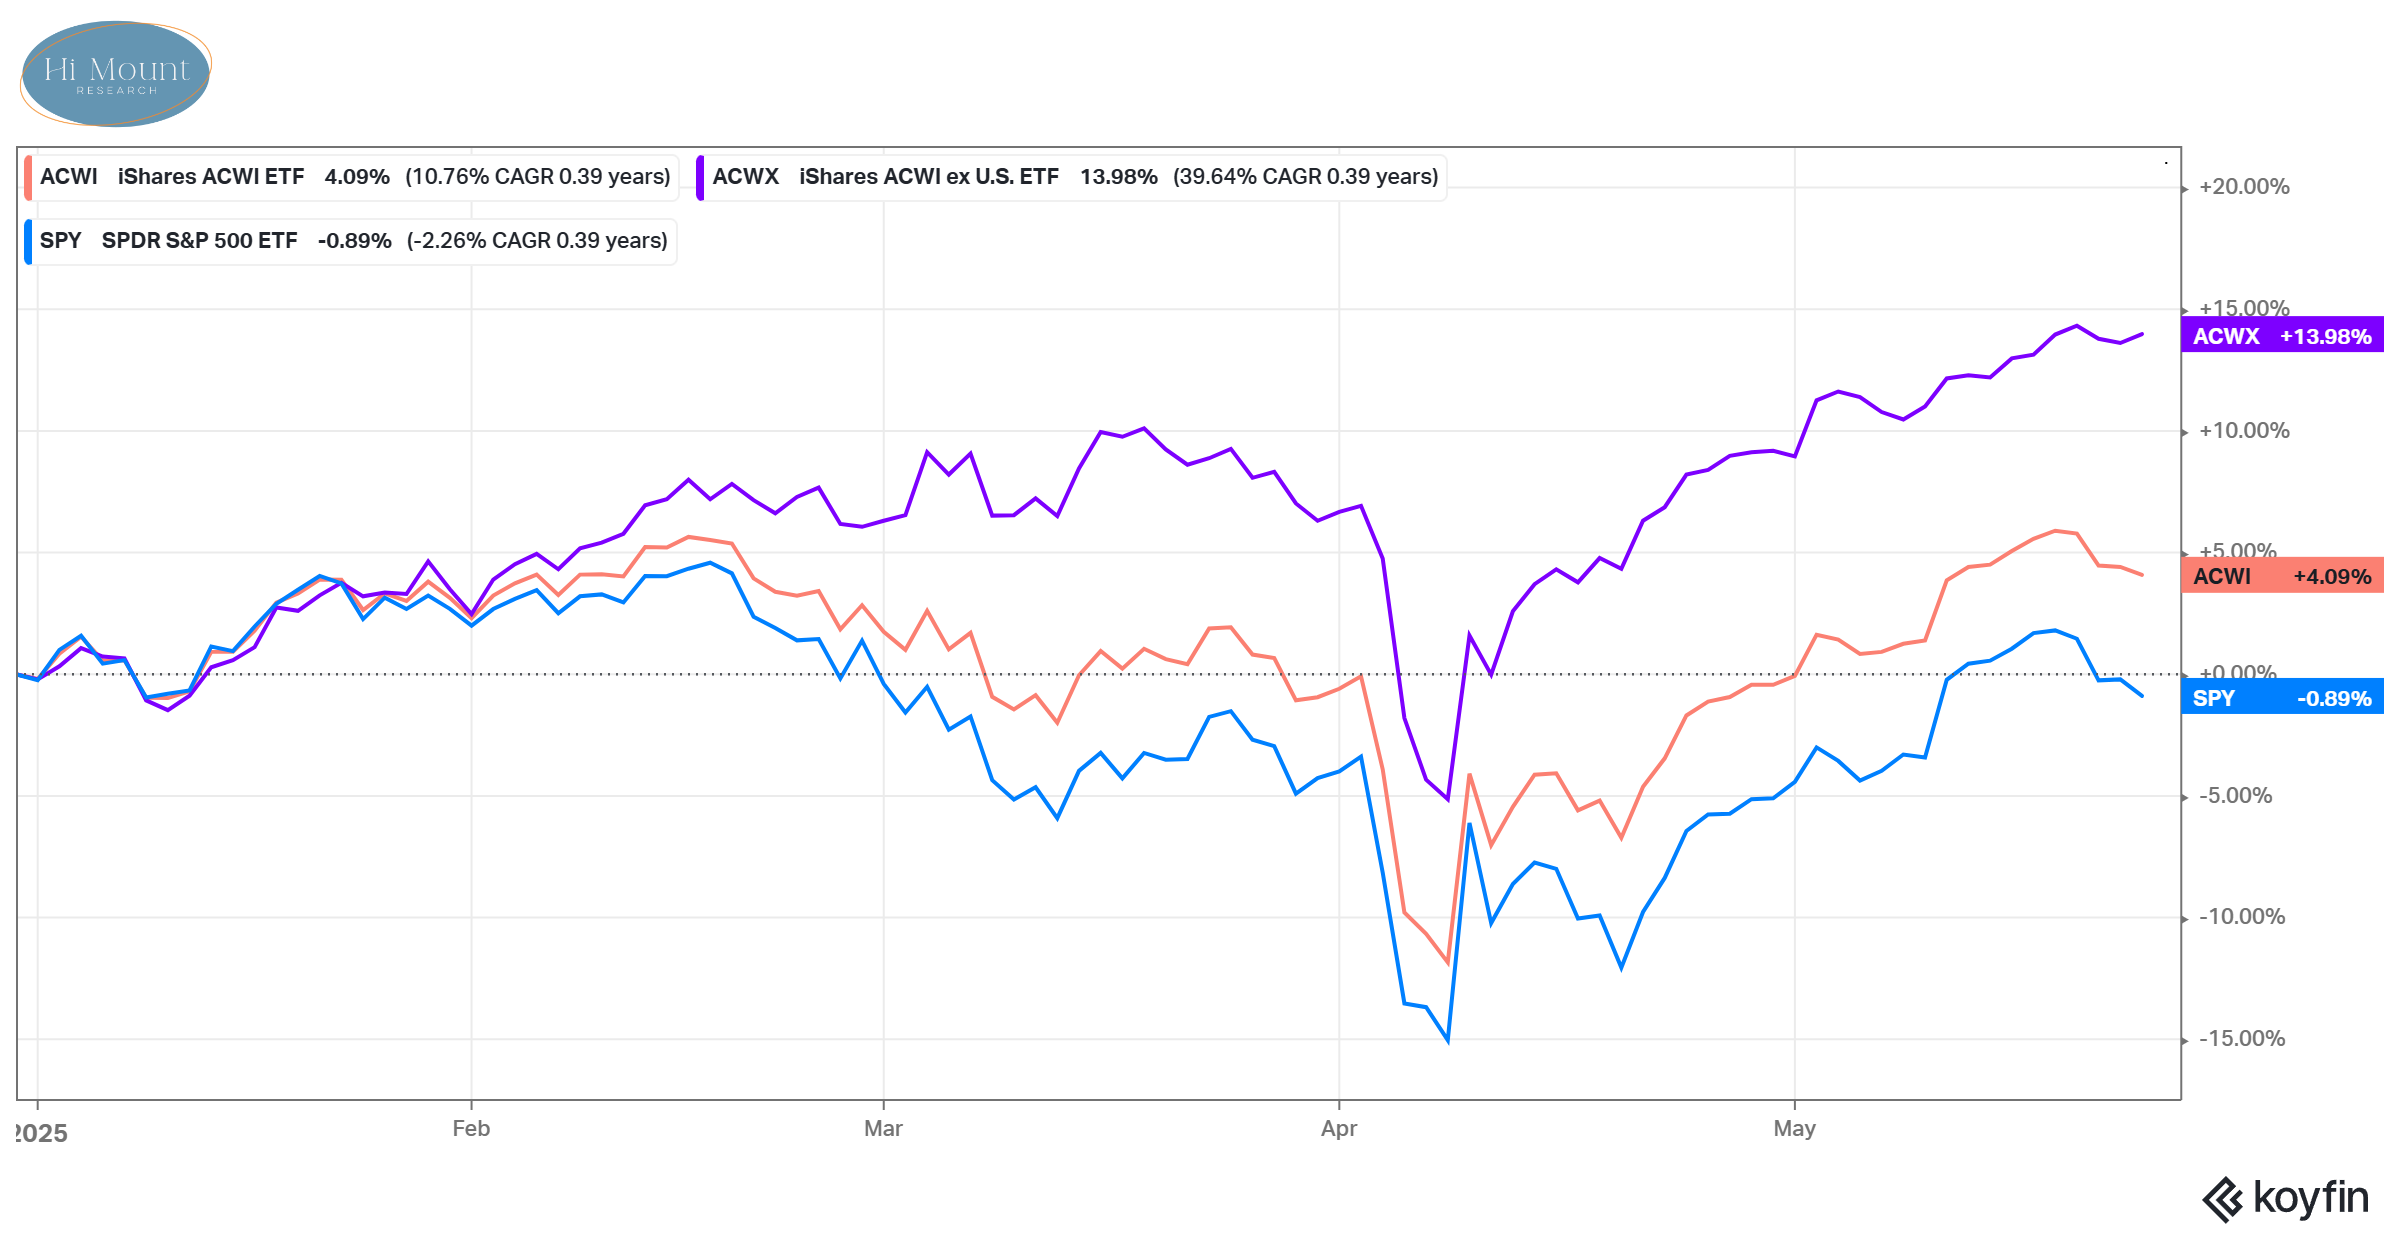
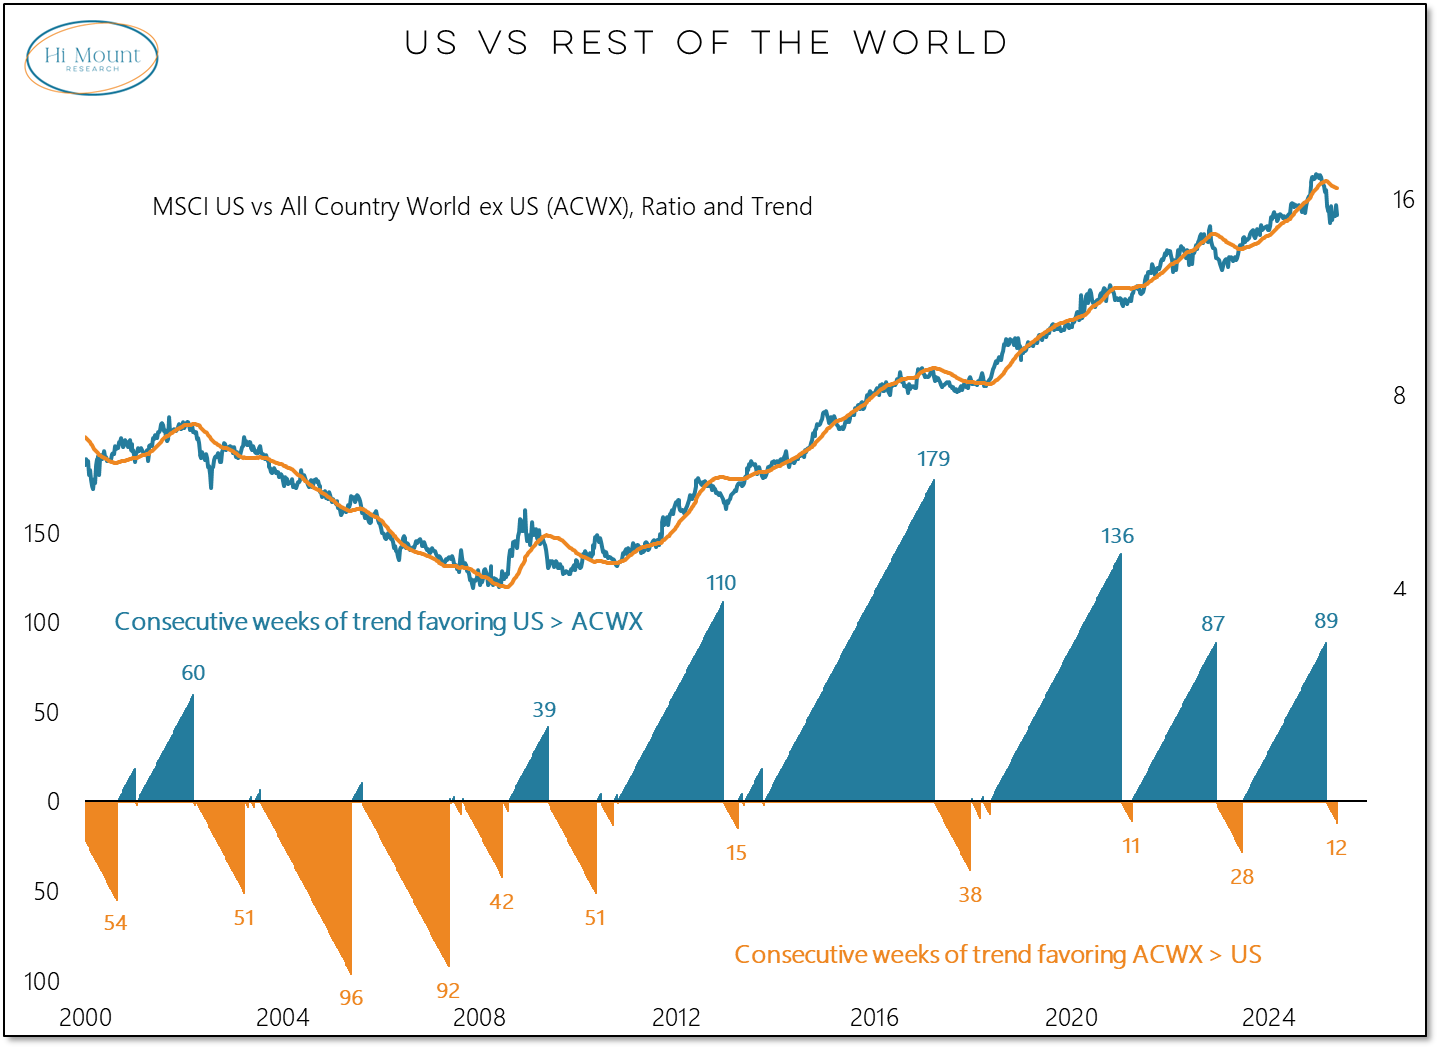
The ACWI ex US is not just posting gains for the year, it is forging ahead into record territory. It closed at a new all-time high for the second week in a row as global equity market strength outside of the US remains broad-based. Our global breadth trend indicator is now pushing toward its highest level since mid-2021.

The persistent trend strength we are seeing around the world contrasts with the more tenuous (i.e. tariff headline dependent) strength that has emerged in the US. While our global trend indicator has made a series of higher lows stretch back to late 2022, our US-based industry group trend indicator undercut its late-2023 low earlier this year and remains below the pivotal 50% threshold.

Even with the S&P 500 rallying nearly 20% from its early April lows, no more than 7 of the eleven sectors in the index have been able to reclaim their 200-day averages. The index tends to struggle when more than 1 but fewer than 9 of the sectors are above their 200-day averages (sector breadth is neither great, nor so bad that it is good).

Zooming out, the ACWI ex US has spend nearly two decades trying to get back to and meaningfully through its pre-Financial Crisis peak. The up-trend has been more persistent of late, but for many US investors adding overseas exposure in recent years has not been worth the added risk and lack of return. With the rest of the world gaining strength on an absolute basis and now showing some leadership versus the US, it is time to revisit conversations about global equity diversification (see our Macro rankings and country-level relative strength rankings below).
As highlighted last week, US equities have the benefit of a tailwind provided by the recent Breadth Thrust. There are two areas that I am watching for confirmation that historical Breadth Thrust Regime patterns are playing out and one regime shift that could challenge those past tendencies.
Keep reading with a 7-day free trial
Subscribe to Hi Mount Research to keep reading this post and get 7 days of free access to the full post archives.