


Tactical Risk Management For The New Year
Absence of breadth thrust is notable, but secondary indicators now tilt toward opportunity

Key Takeaways:
Absence of a breadth thrust leaves market looking for energy elsewhere
Liquidity indicator remains supportive but Macro Sentiment has turned cautious.
Short-term breadth improvement gives model a favorable tilt heading into 2022.
There was a story in the WSJ earlier this year about a fund manager who held 900 of his best ideas in his main mutual fund. I saw a model this summer that was made up of nearly 100 individual momentum indicators. Some will use a double-digit number of categories for gauging the market. One more holding, one more indicator, one more lever - it’s as easy as adding one more column in the spreadsheet. If more is better that is great, the question though is at what point is more just too much.
Information, even when useful, can easily pile up and become overwhelming. This adds to, rather than reduces noise. Distillation is an ongoing challenge in this age of distraction. There is a tension between focusing on as much as we need to, but as little as we have to. This can matter to investors facing the prospect of wading through 2022 outlook pieces filled with forecasts, expectations and a myriad of moving parts. I’d rather focus on just a few (less than a handful) of indicators for identifying risk and opportunity next year. I expect they will matter in 2022 because they have mattered most of the time in recent years.
This approach starts with a look at breadth thrusts. Specifically, we are looking for 90% or more of a broad universe of multi-cap stocks trading above their 50-day averages and/or 55% or more of S&P 500 stocks closing at new 20-day highs. History shows that the market tends to produce well-above average returns for up to a year following the most recent breadth thrust.
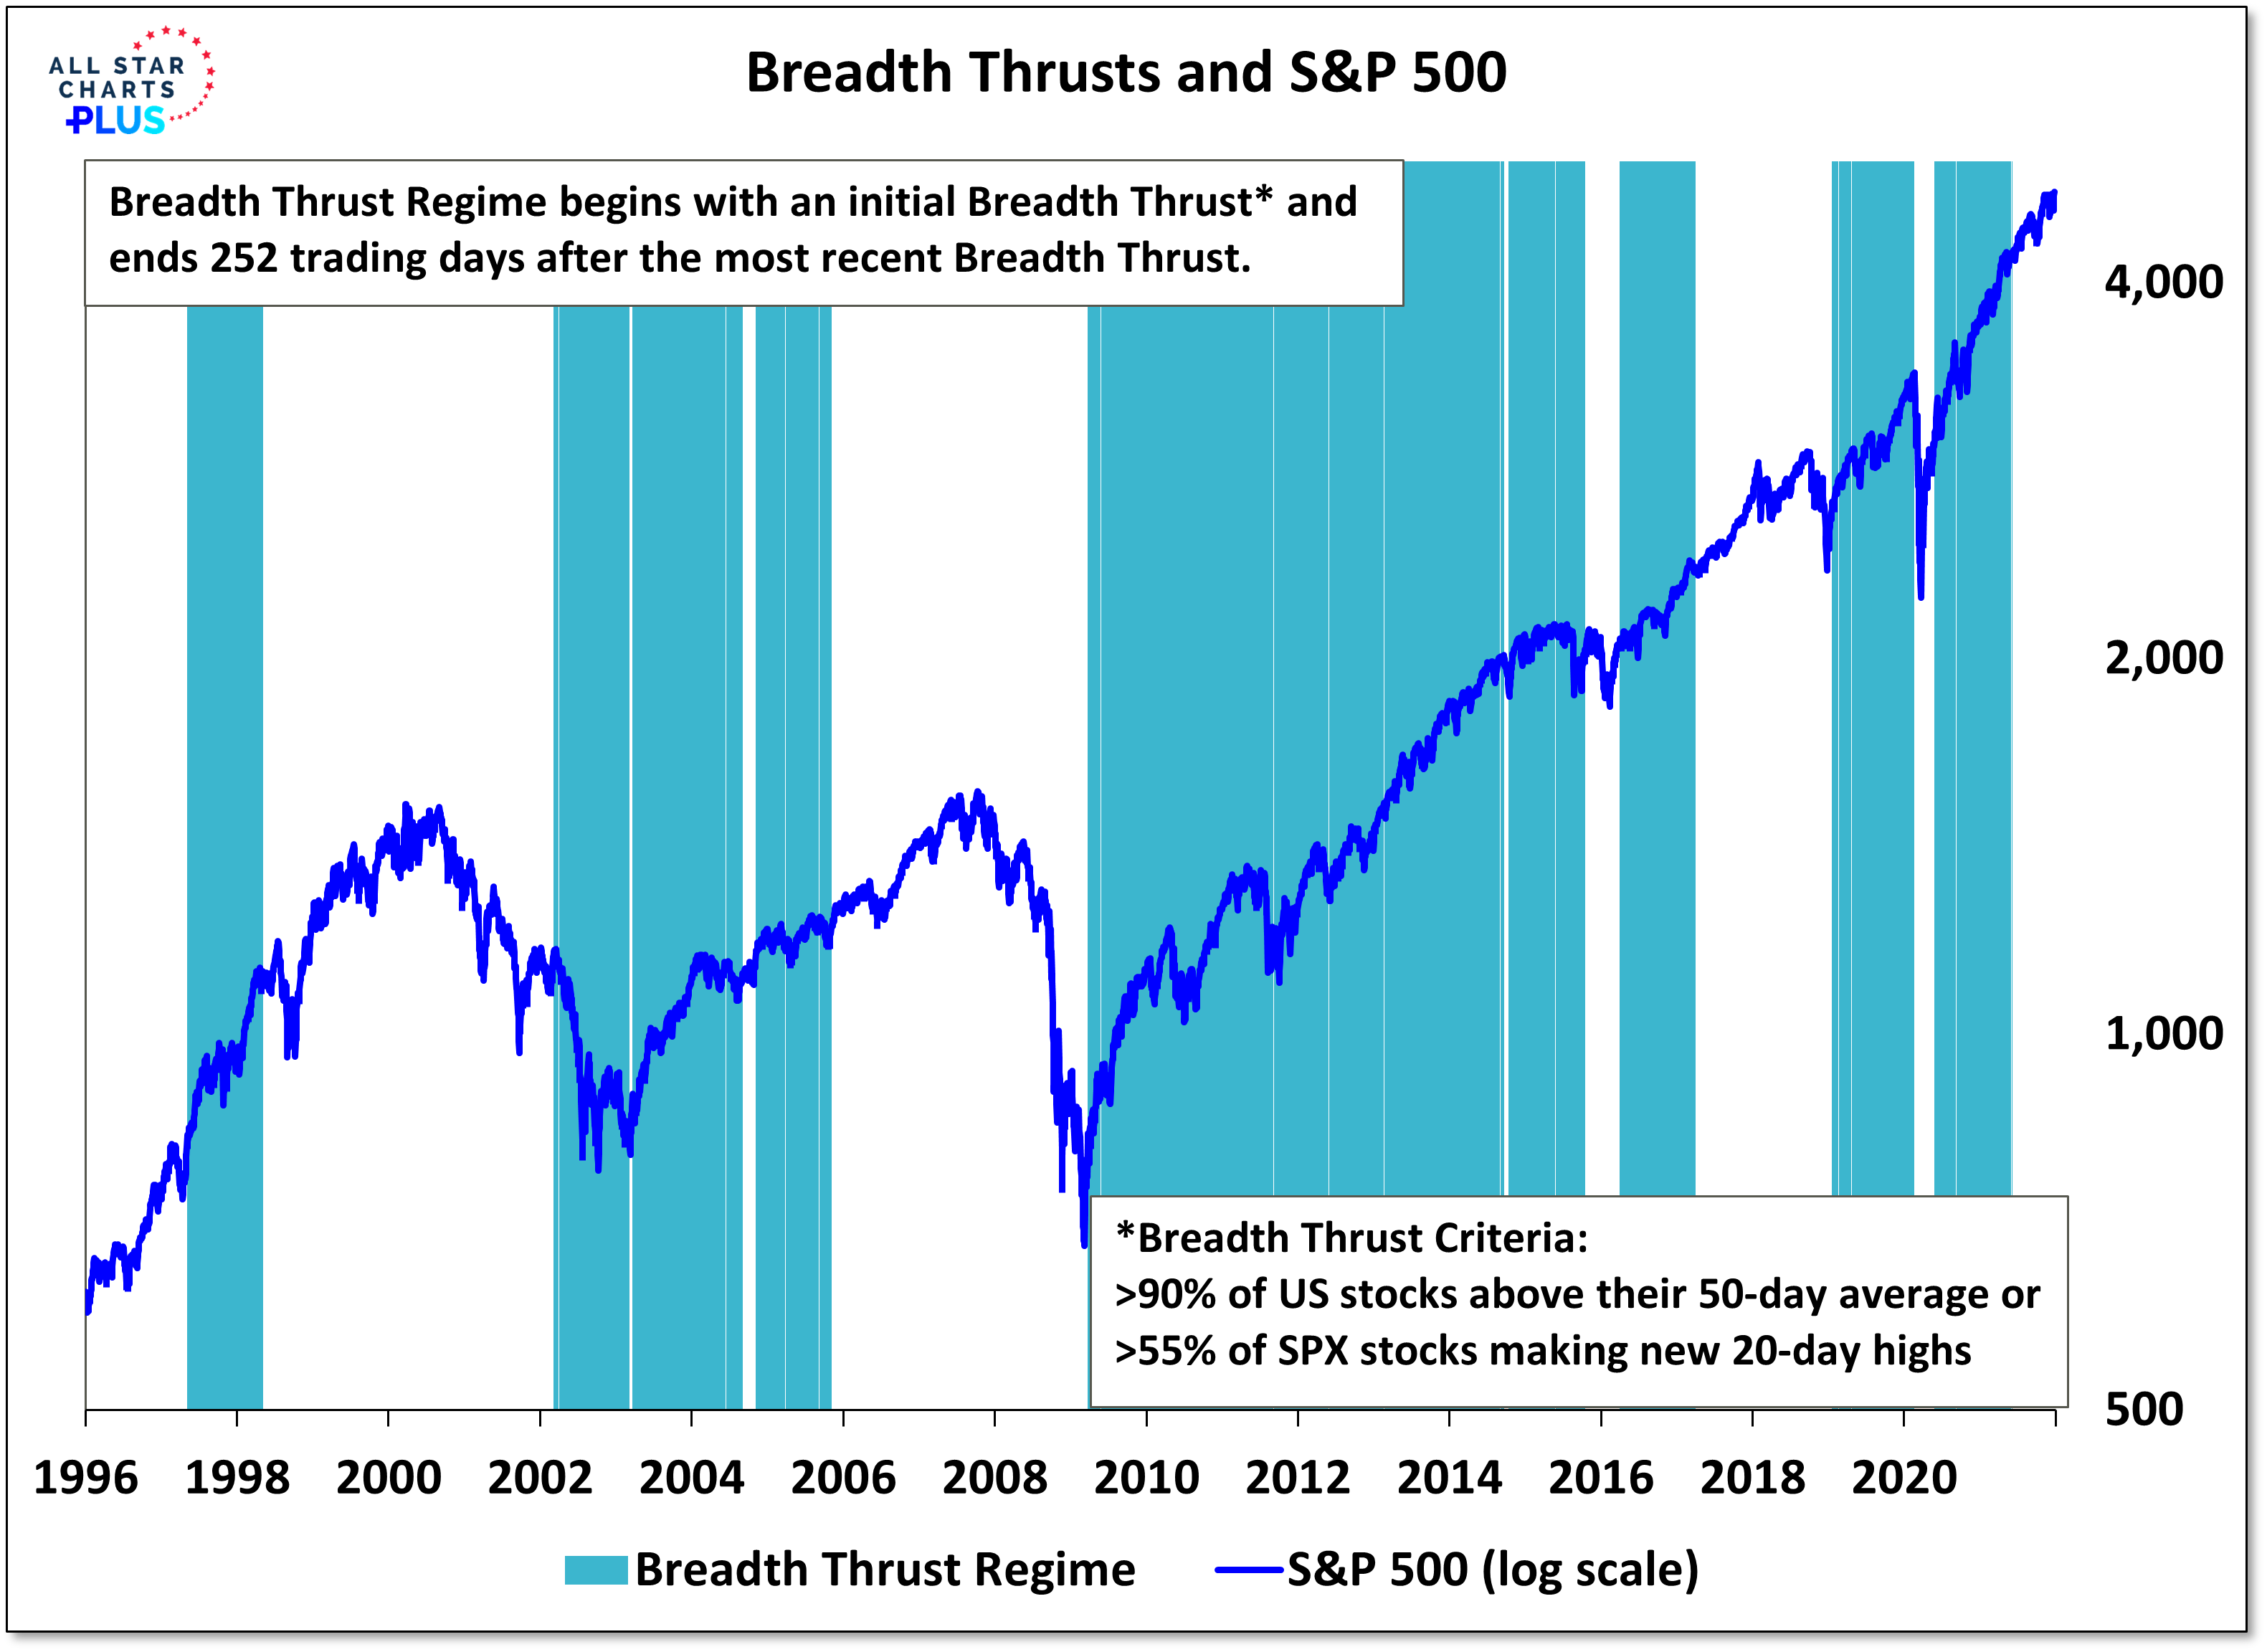
Breadth thrust regimes usually provide strong returns but have covered the market 55% of the time over the past quarter century. In doing so, they have captured almost all the net upside for the S&P 500 in that time period. That is a good starting point, but that would have left an investor sitting on the sidelines, itching for action, for 45% of the time. That is probably more than enough time to abandon the approach and get into trouble.
A trio of additional indicators can be used as a risk vs opportunity guide during times when a prior breadth thrust signal has expired but a subsequent signal has not yet emerged. We have discussed these as stand alone indicators in the past:
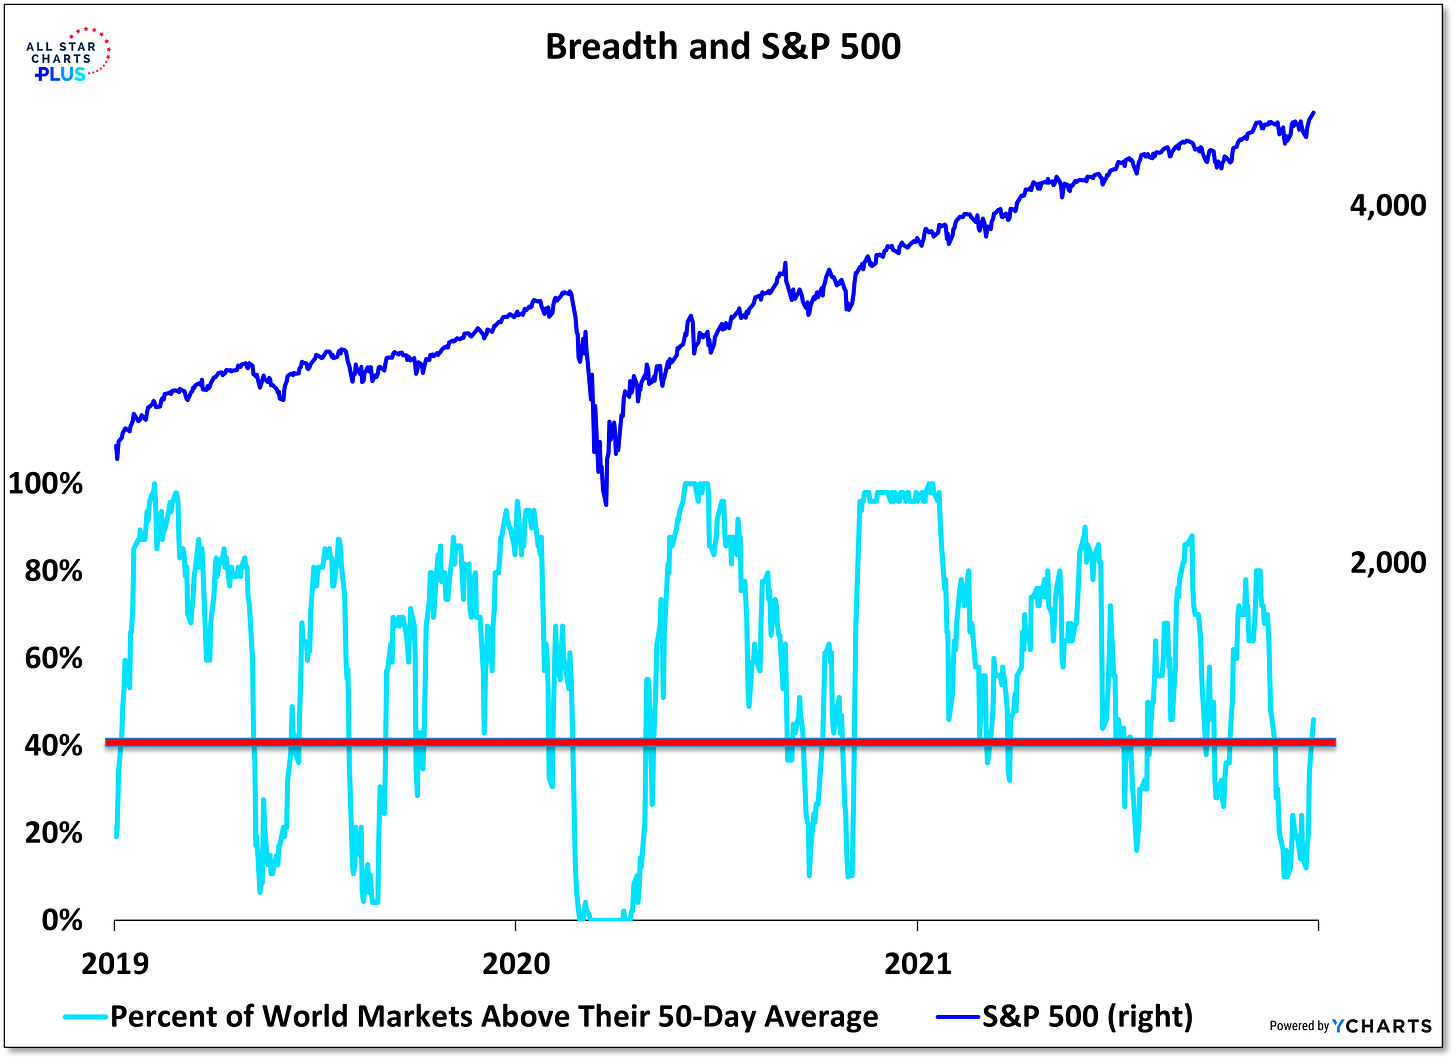
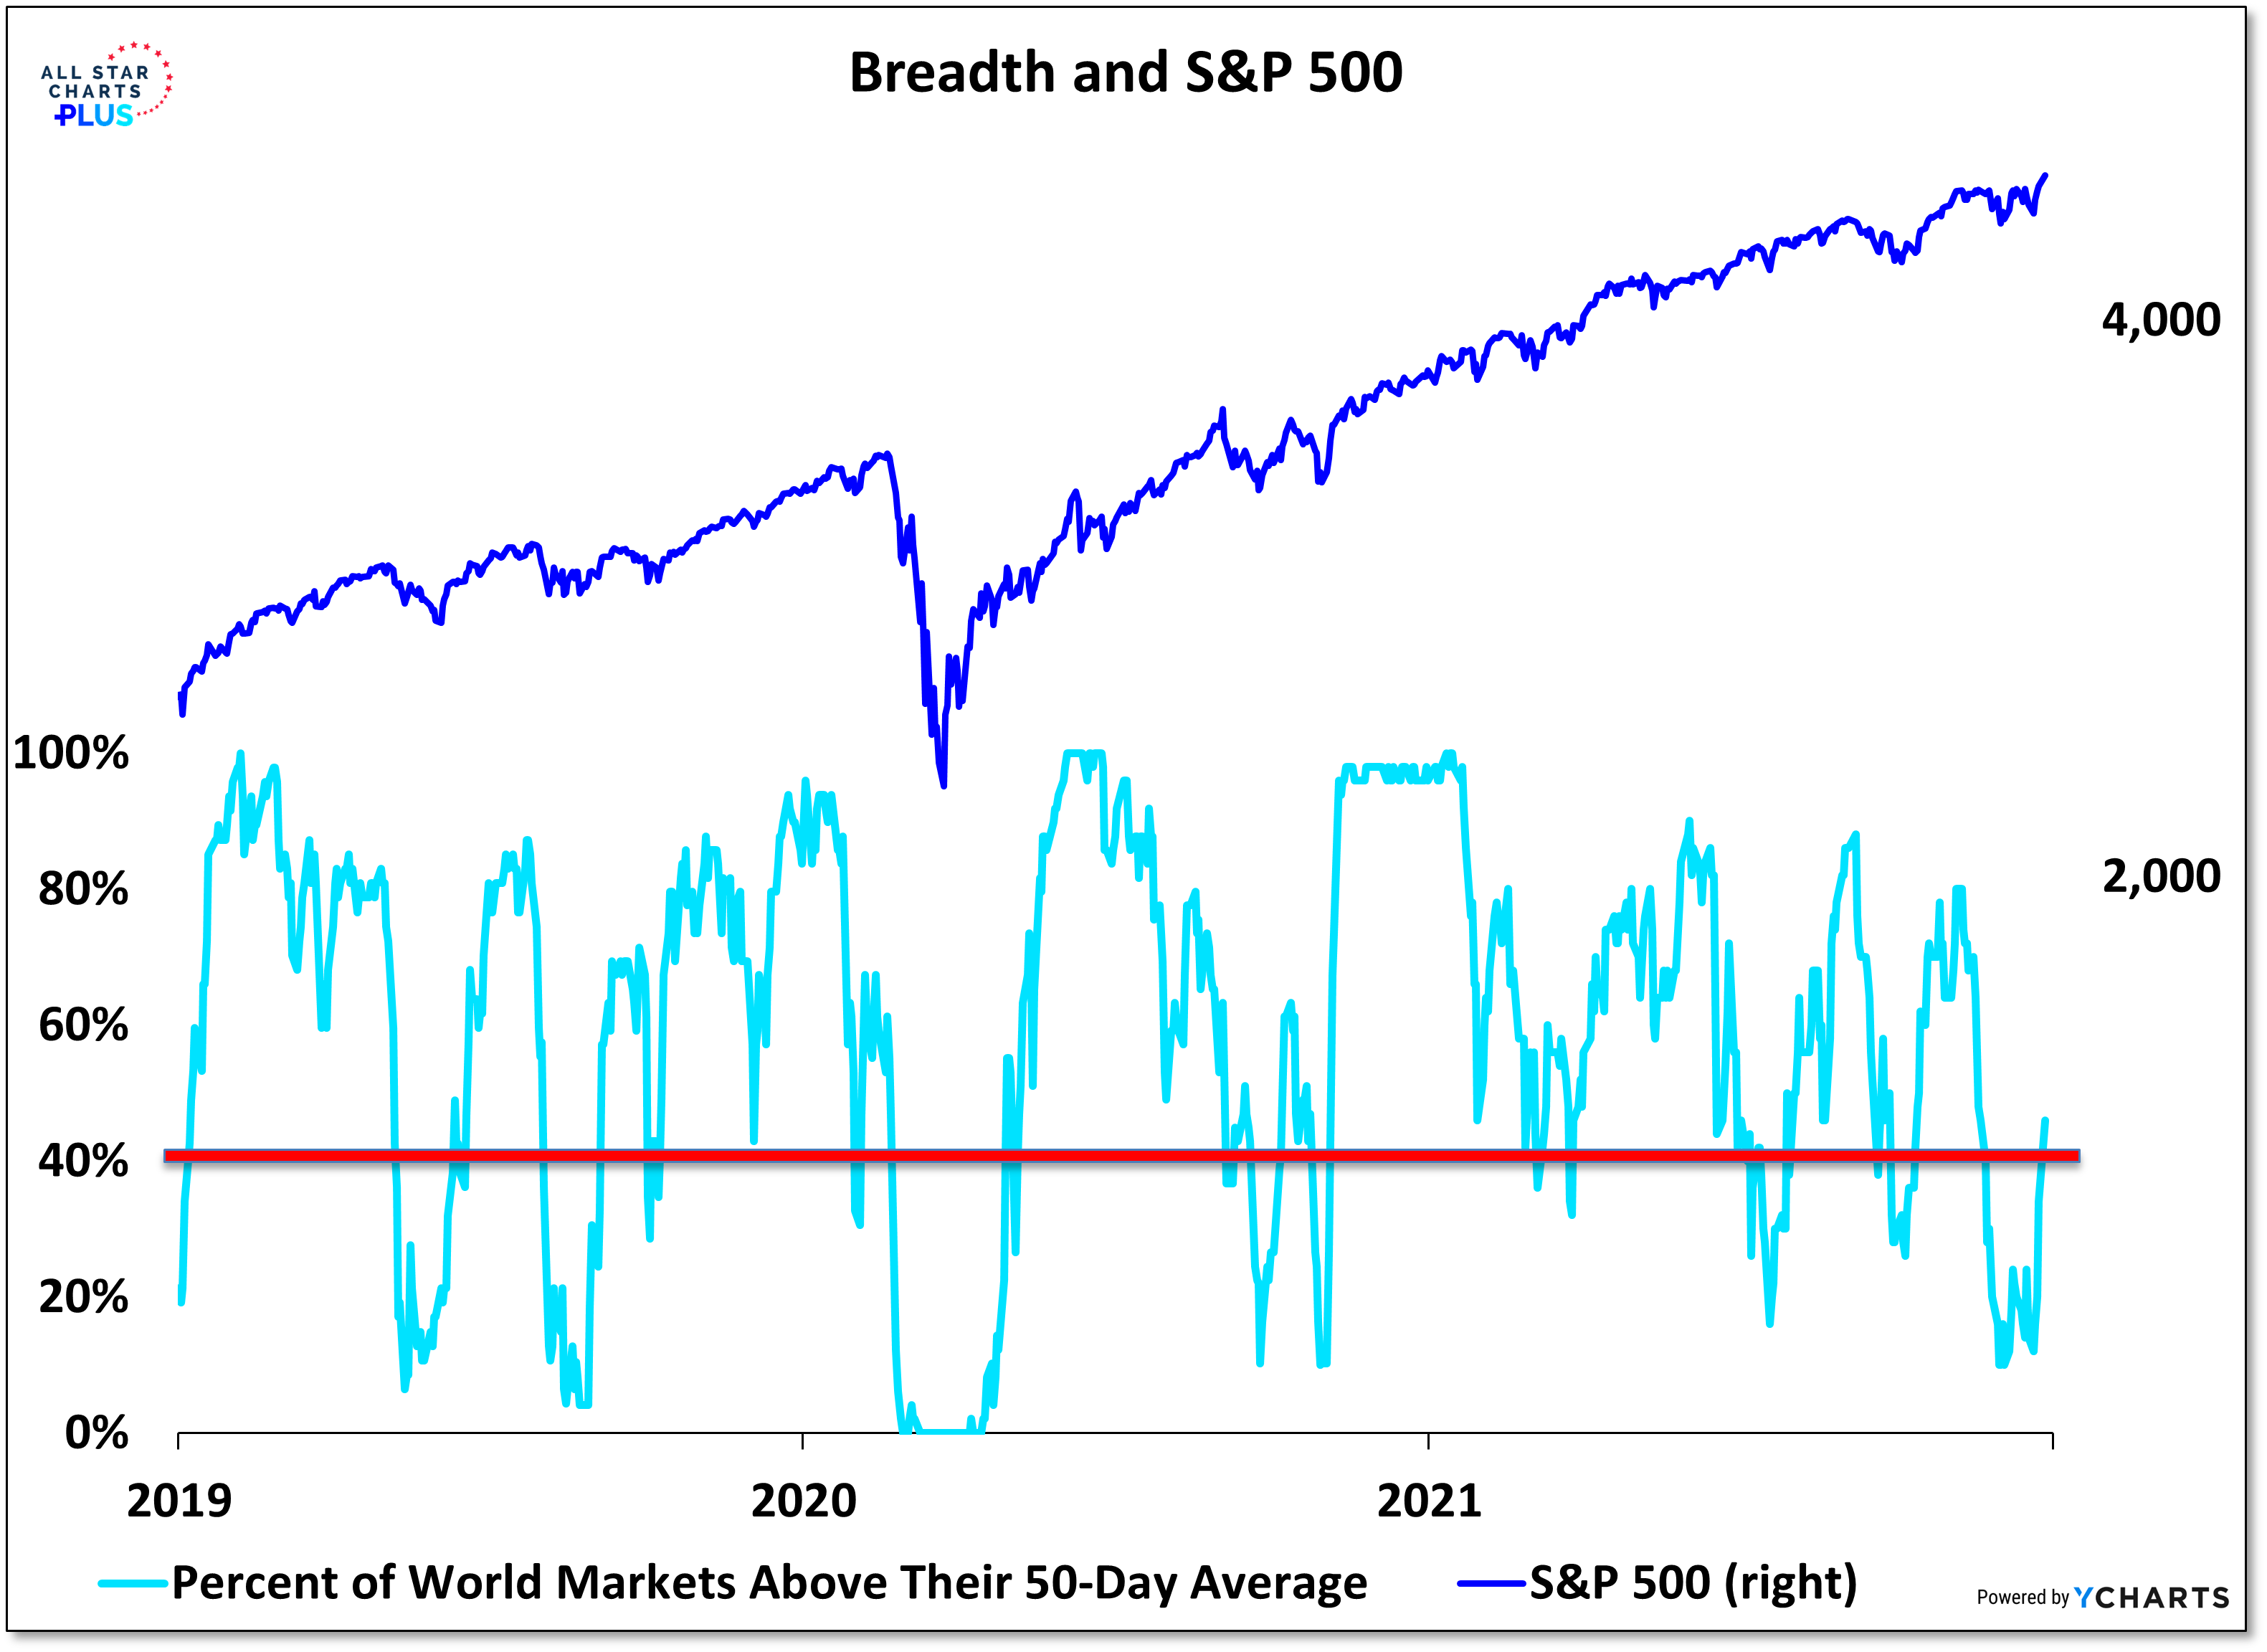
Breadth: The percentage of global (ACWI) markets above their 50-day averages. When it is at 40% or above, it signals opportunity, below 40% and it signals risk.
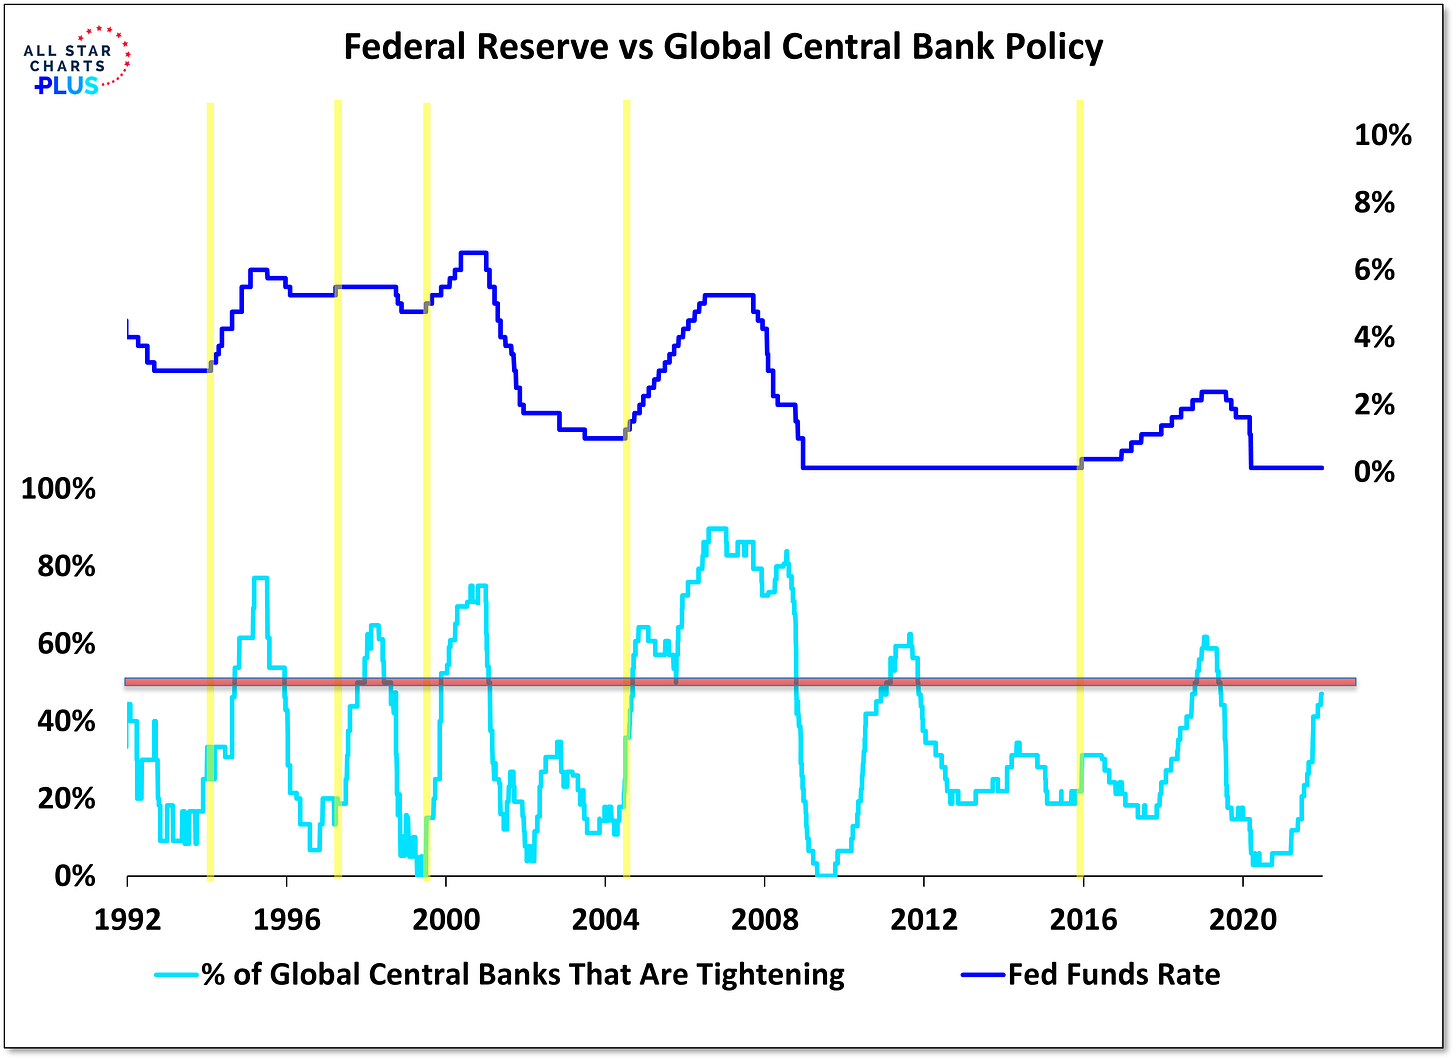
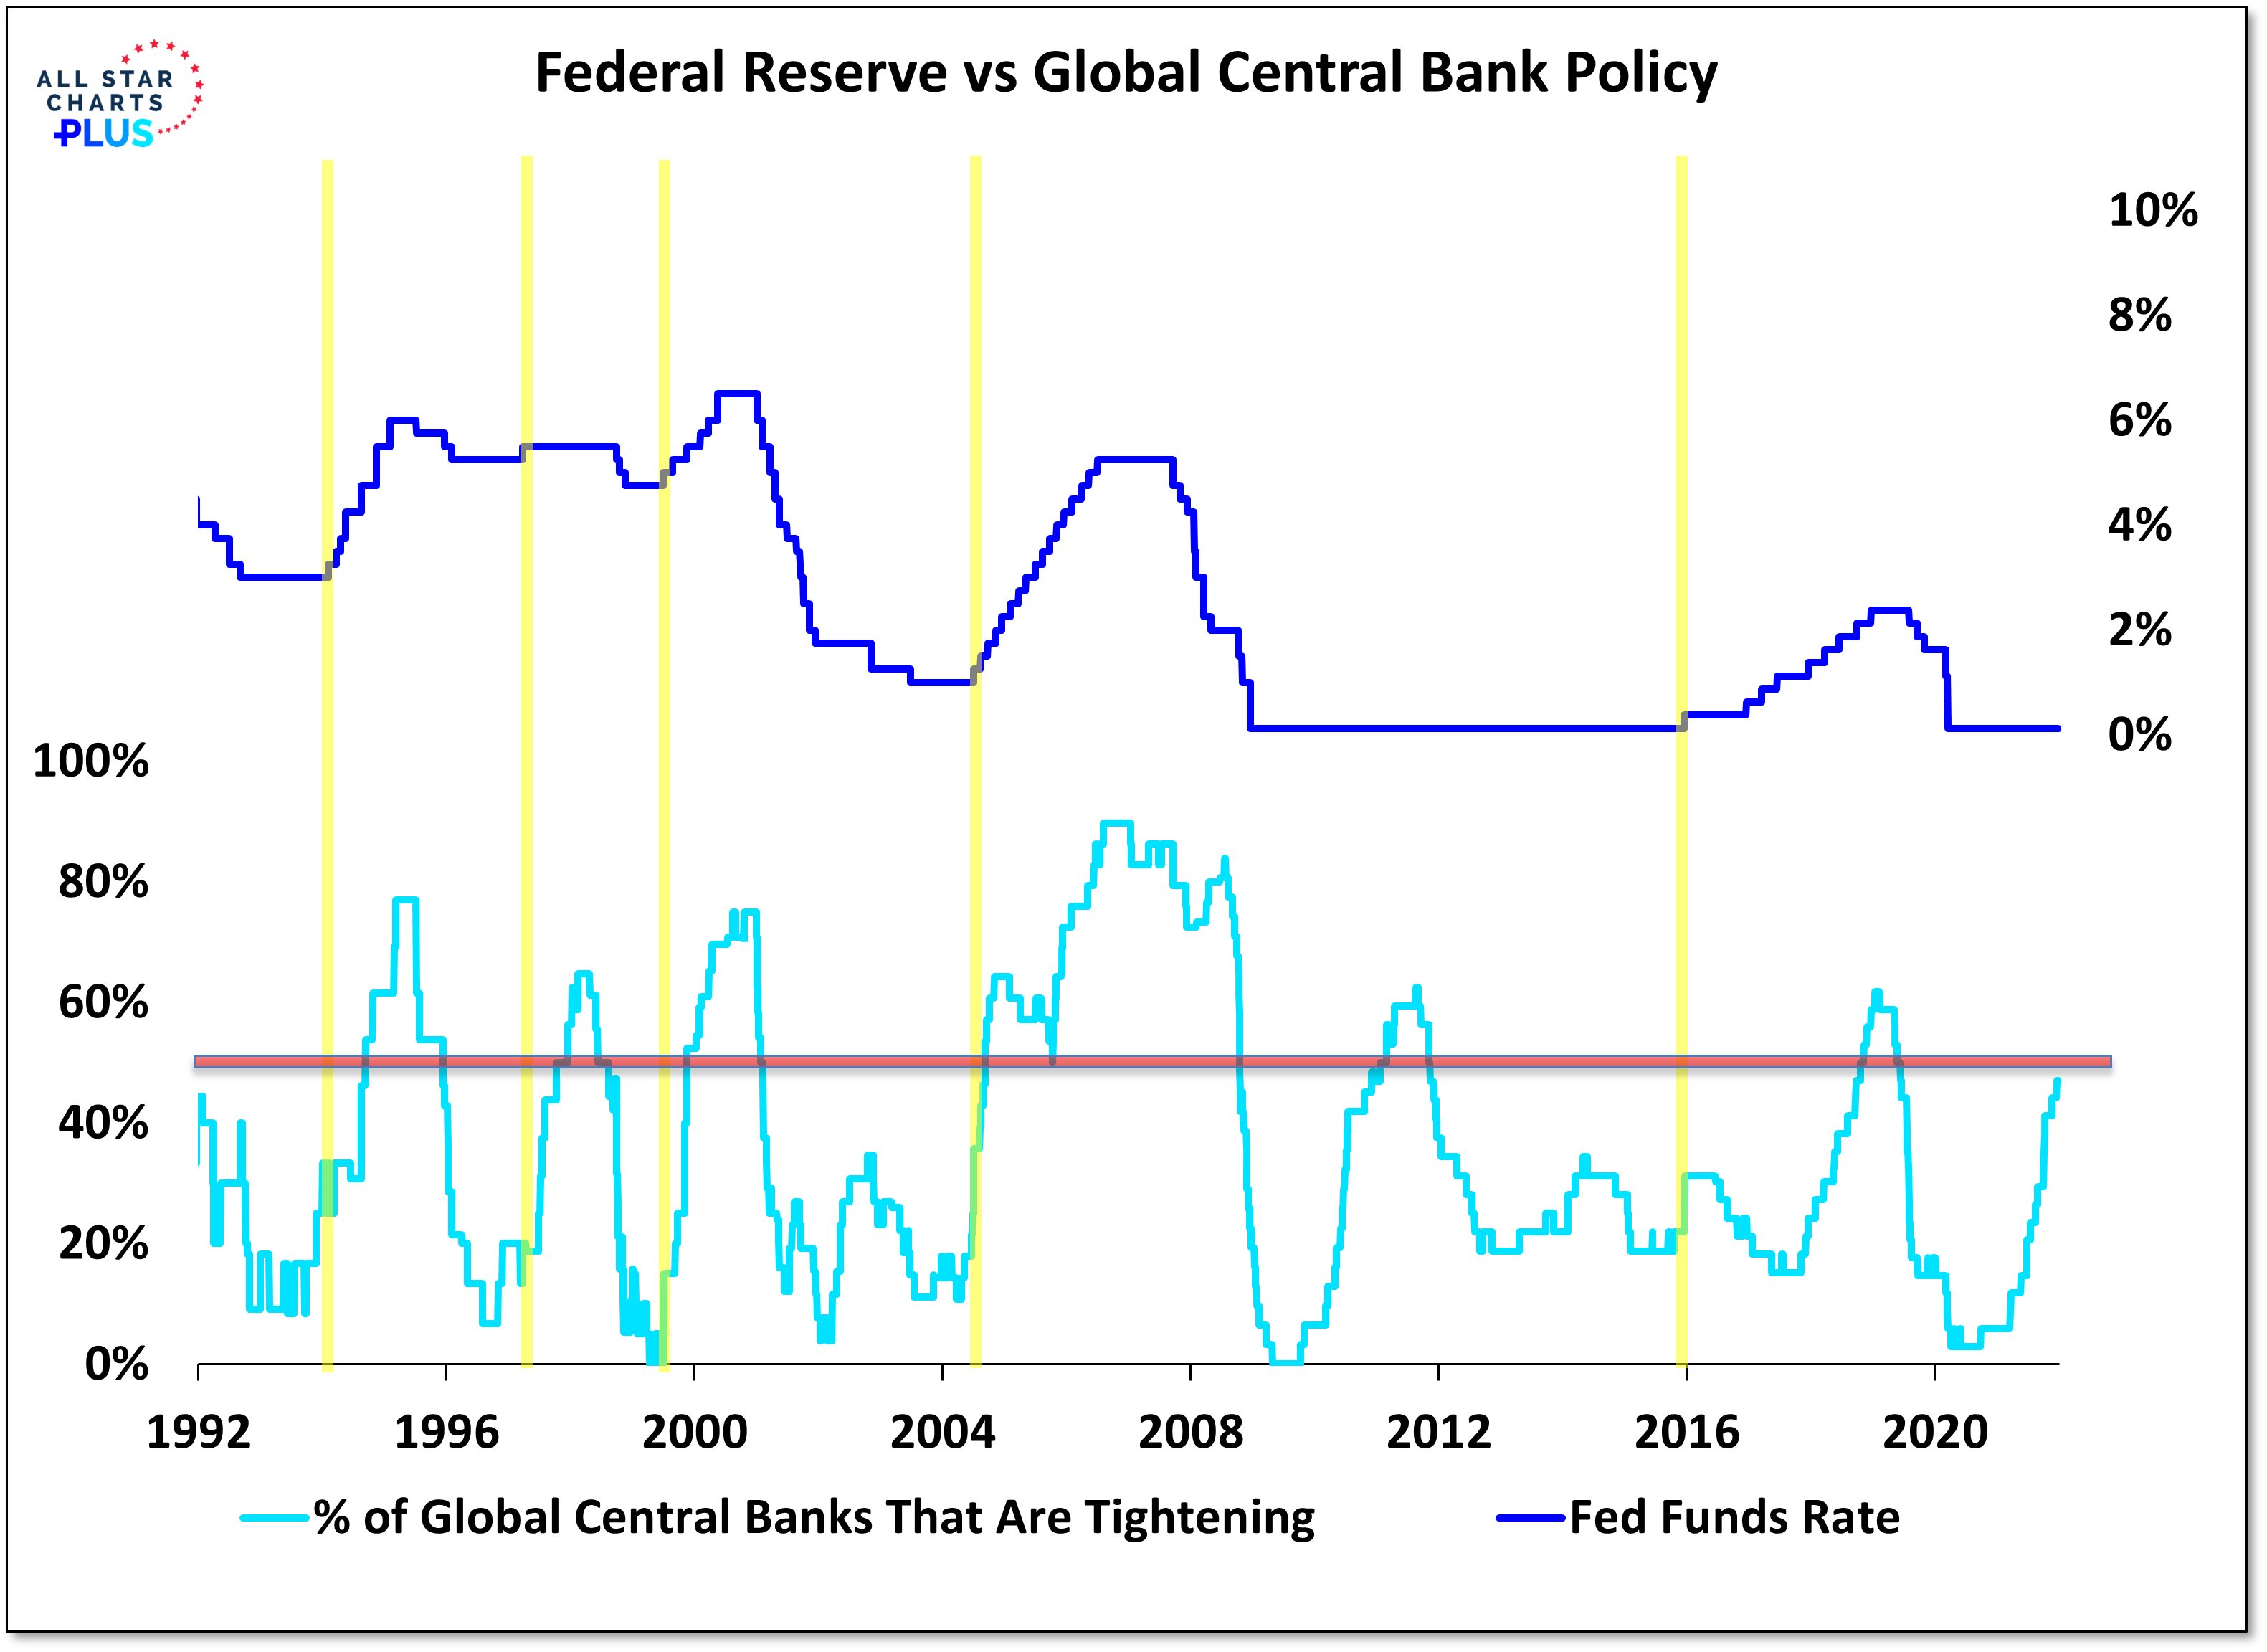
Liquidity: The percentage of global central banks that are raising interest rates. When it is less than 50% it signals opportunity; above 50% and it signals risk.
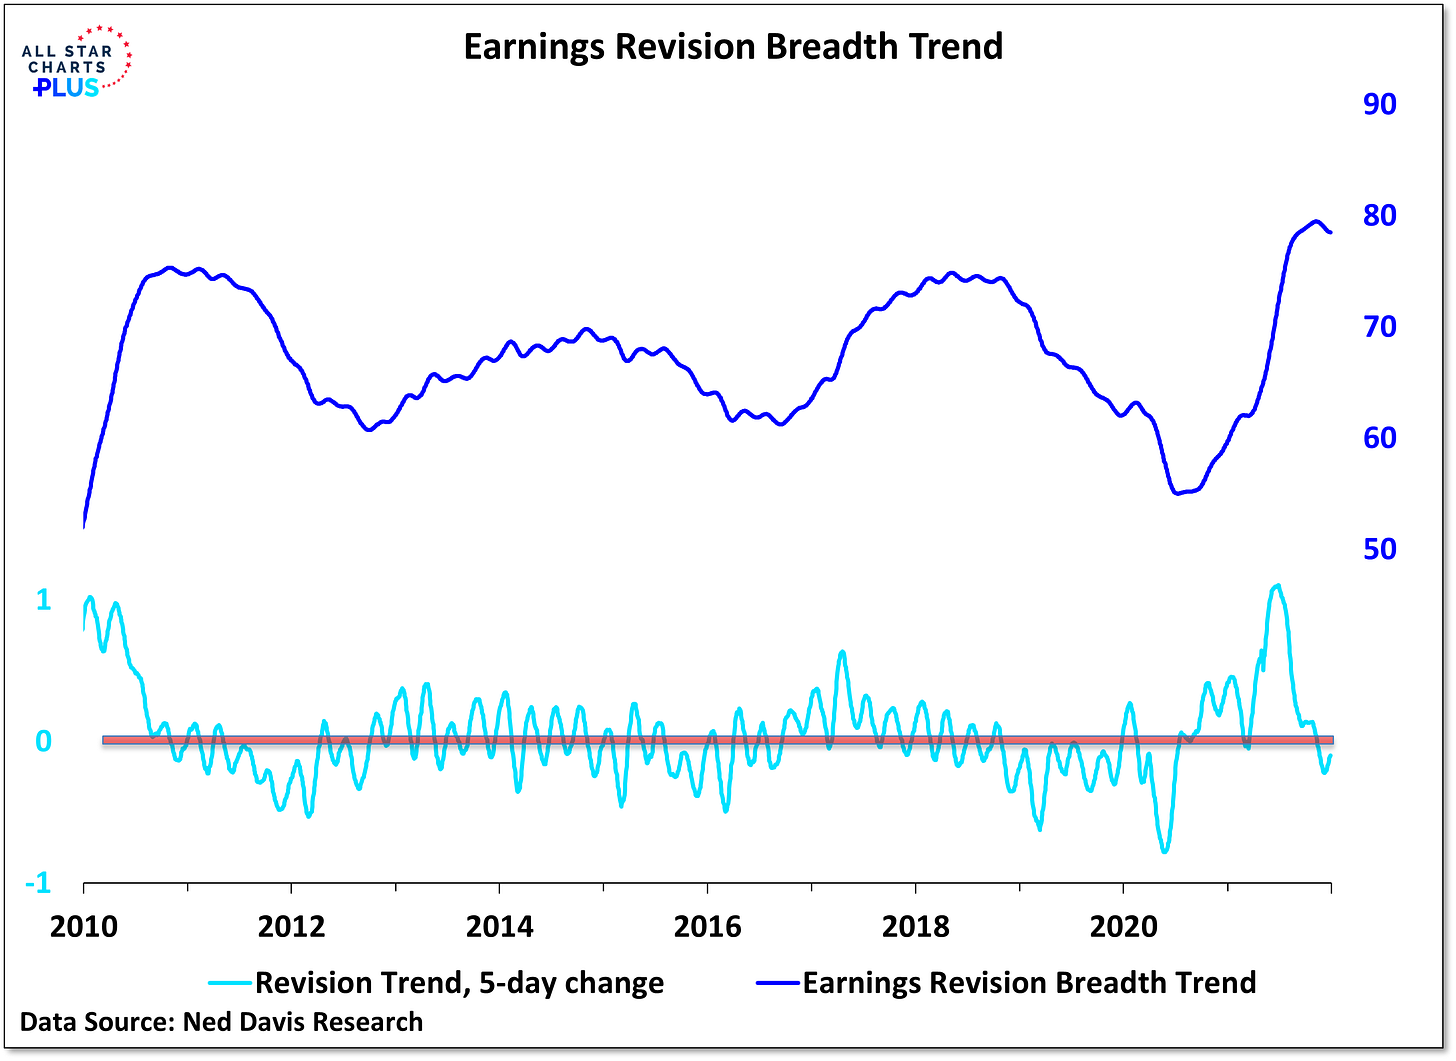
Sentiment/Macro: Earnings revisions trends. If the earnings revision breadth trend is rising it signals opportunity; when it is falling, it signals risk.

If any to two of these indicators signal opportunity, the model is bullish even in the absence of a breadth thrust regime. Otherwise the model argues for moving to the sidelines. By adding this additional layer, the model would have been long more than 80% of the time in the past quarter century. In the 20% of the time that this model argued for being on the sidelines, the S&P 500 has fallen at a 10% annual rate.
Current Readings:
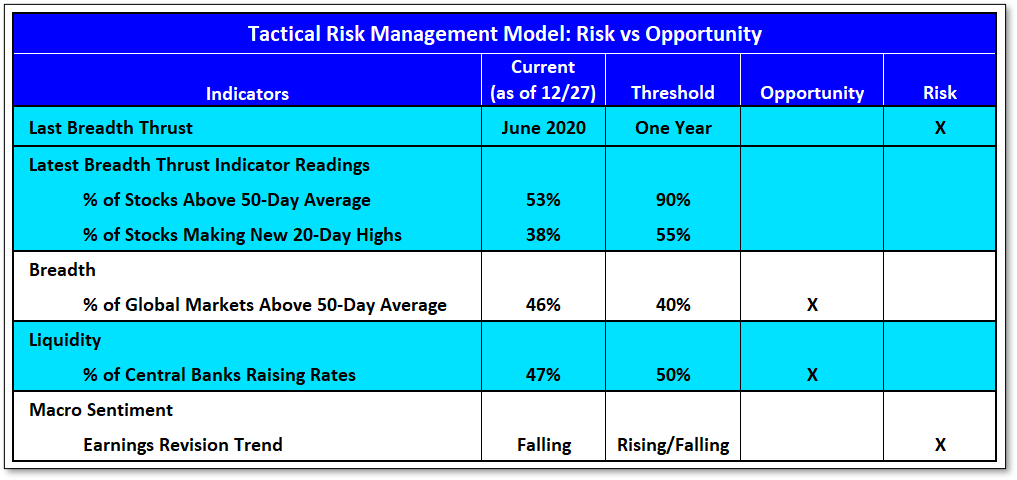
The most recent breadth thrust regime expired in June. Our breadth thrust indicators are moving higher but remain shy of their key thresholds.
The percentage of world markets trading above their 50-day averages has improved considerably, rising from 12% to 46% over the past week.
The percentage of central banks tightening is climbing but remains below 50%.
The earnings revision trend has rolled over for the first time in a year.
Near-term breadth improvement has this tactical model tilting back toward opportunity as the year winds down.
The best chance for sustained improvement is probably for recent breadth improvement to be followed by a breadth thrust sooner rather than later. This would the stock market’s odds of producing sustained strong returns next year.
As we move into 2022 we will continue to flesh out how investors could incorporate this model as a risk management tool and will be using it to guide the exposure in our own Dynamic Tactical Opportunity Portfolio.