Strength Has Been Remarkable But Should Not Be Surprising
Historic advance fueled by surging momentum and broad support
Portfolio Applications subscribers can get more detail in this week’s Relative Strength Rankings and Fear or Strength Model updates.
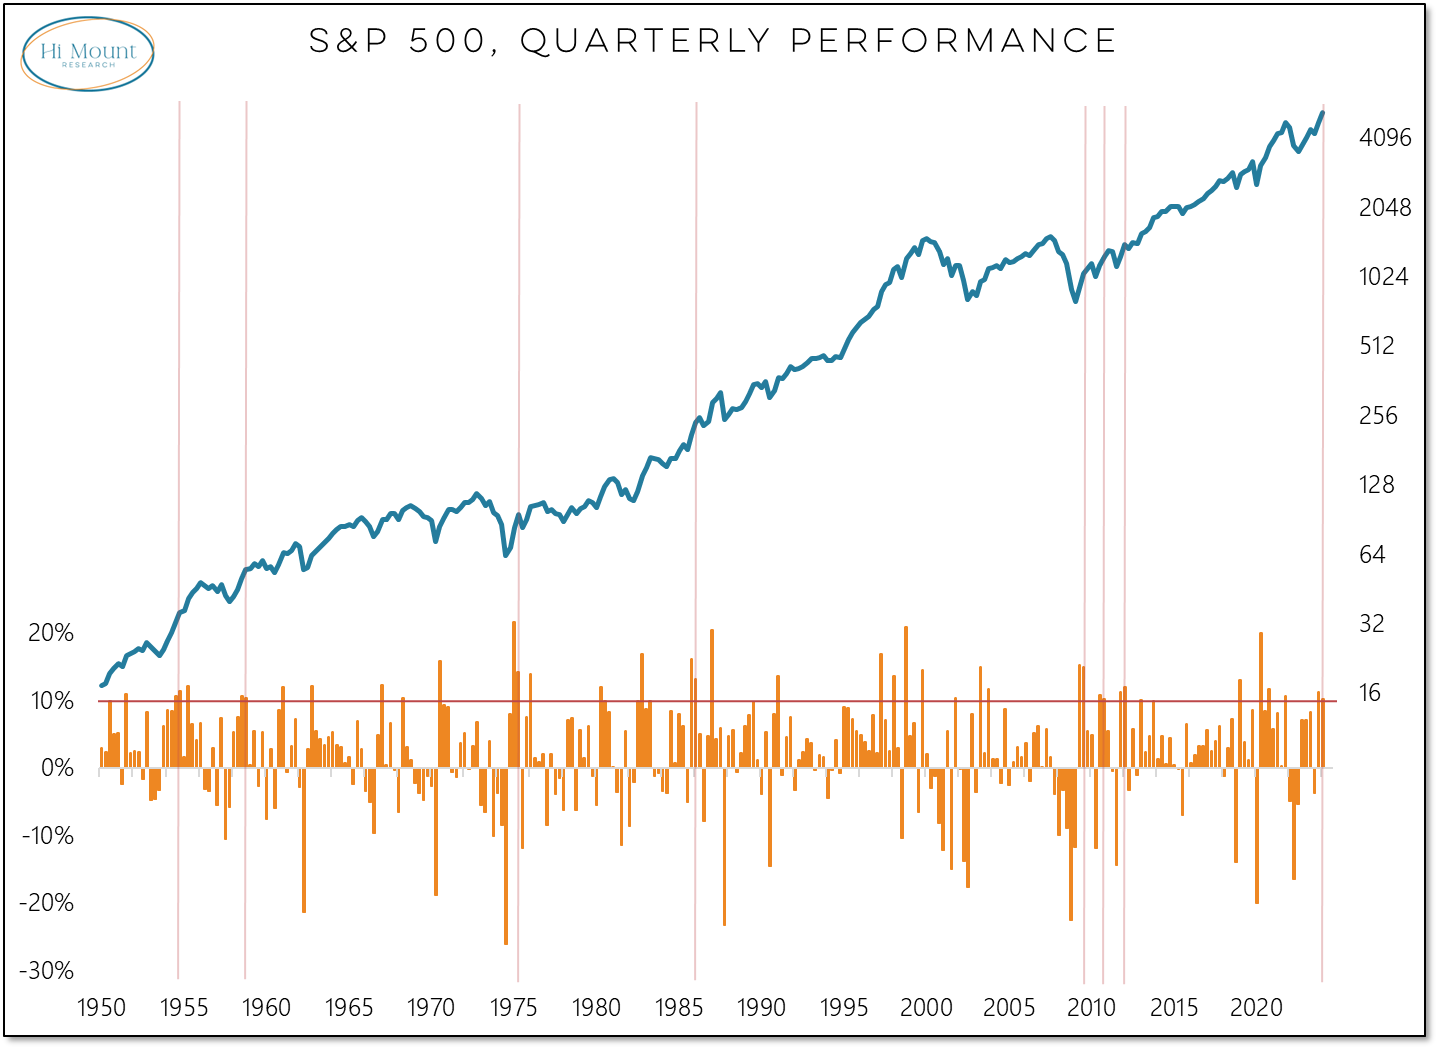
Key Takeaway: The S&P 500 notched a second consecutive quarterly gain of 10%+. Last year’s breadth thrust provides a bullish backdrop for the rally, while new highs outpacing new lows helps fuel continued strength.
It’s been over a decade since the S&P 500 last recorded back-to-back quarterly gains of 10%+. It had only happened a total of seven previous times going back to 1950. None of the previous instances has led to protracted weakness. More often we have seen strength begetting strength.
The seeds for this strength were sown last year as the rally off of the October lows was strong enough to lead to surge in 20-day new highs on the S&P 500 and another breadth thrust.
Breadth thrusts are not one-and-done events. The indicators of market environment and they tend to be followed by strength that persists for up to a year. All of the net gains in the S&P 500 over the past quarter century have come within the confines of these breadth thrust regimes.
While breadth thrusts provide historical context, our Fear or Strength Model provides real-time confirmation. The message here is straight-forward: when more stocks are making new highs than new lows, index-level strength persists. The pattern of new of new highs versus new lows has turned more positive over the past two quarters.
This broad strength helps mitigate near-term concerns about elevated exposure to equities and excessive investor optimism.
While our Macro-based relative strength rankings show a healthy dose of global equity market leadership, there are other pockets of strength that are asking for attention from an asset allocation perspective:
Keep reading with a 7-day free trial
Subscribe to Hi Mount Research to keep reading this post and get 7 days of free access to the full post archives.


