


Running Over The Same Old Ground
An expansion in new YTD lows in September is not typically bull market behavior

Key Takeaway: Stocks are struggling for traction as new lists expand. Relative strength trends are showing defensive leadership at the macro level even if it isn't showing up at the sector-level.
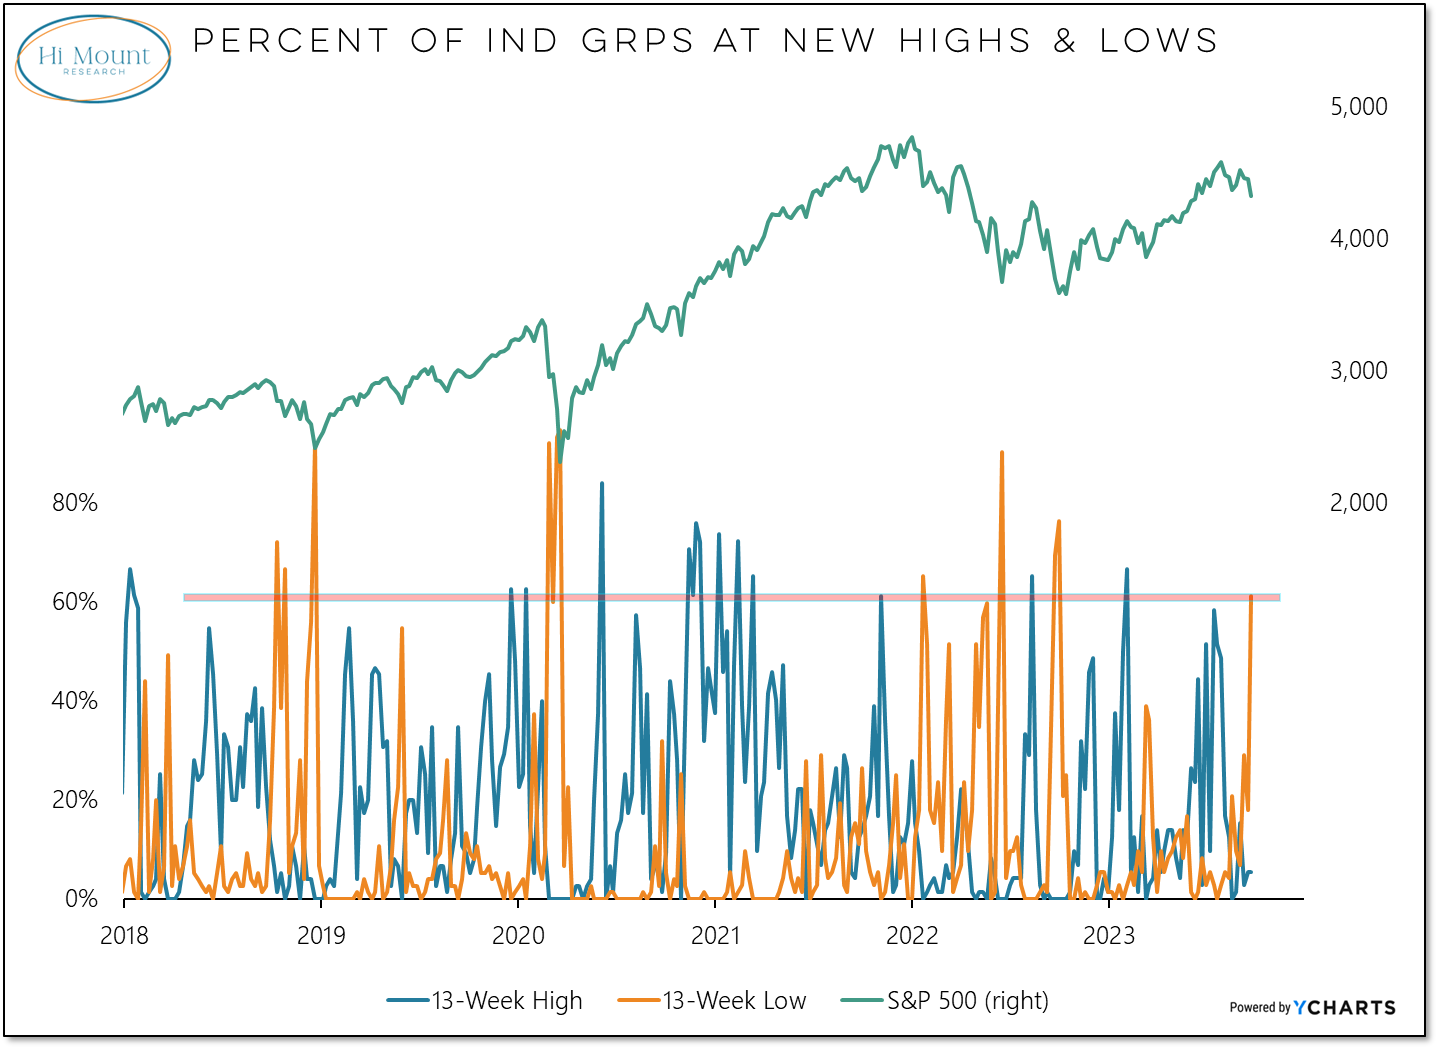
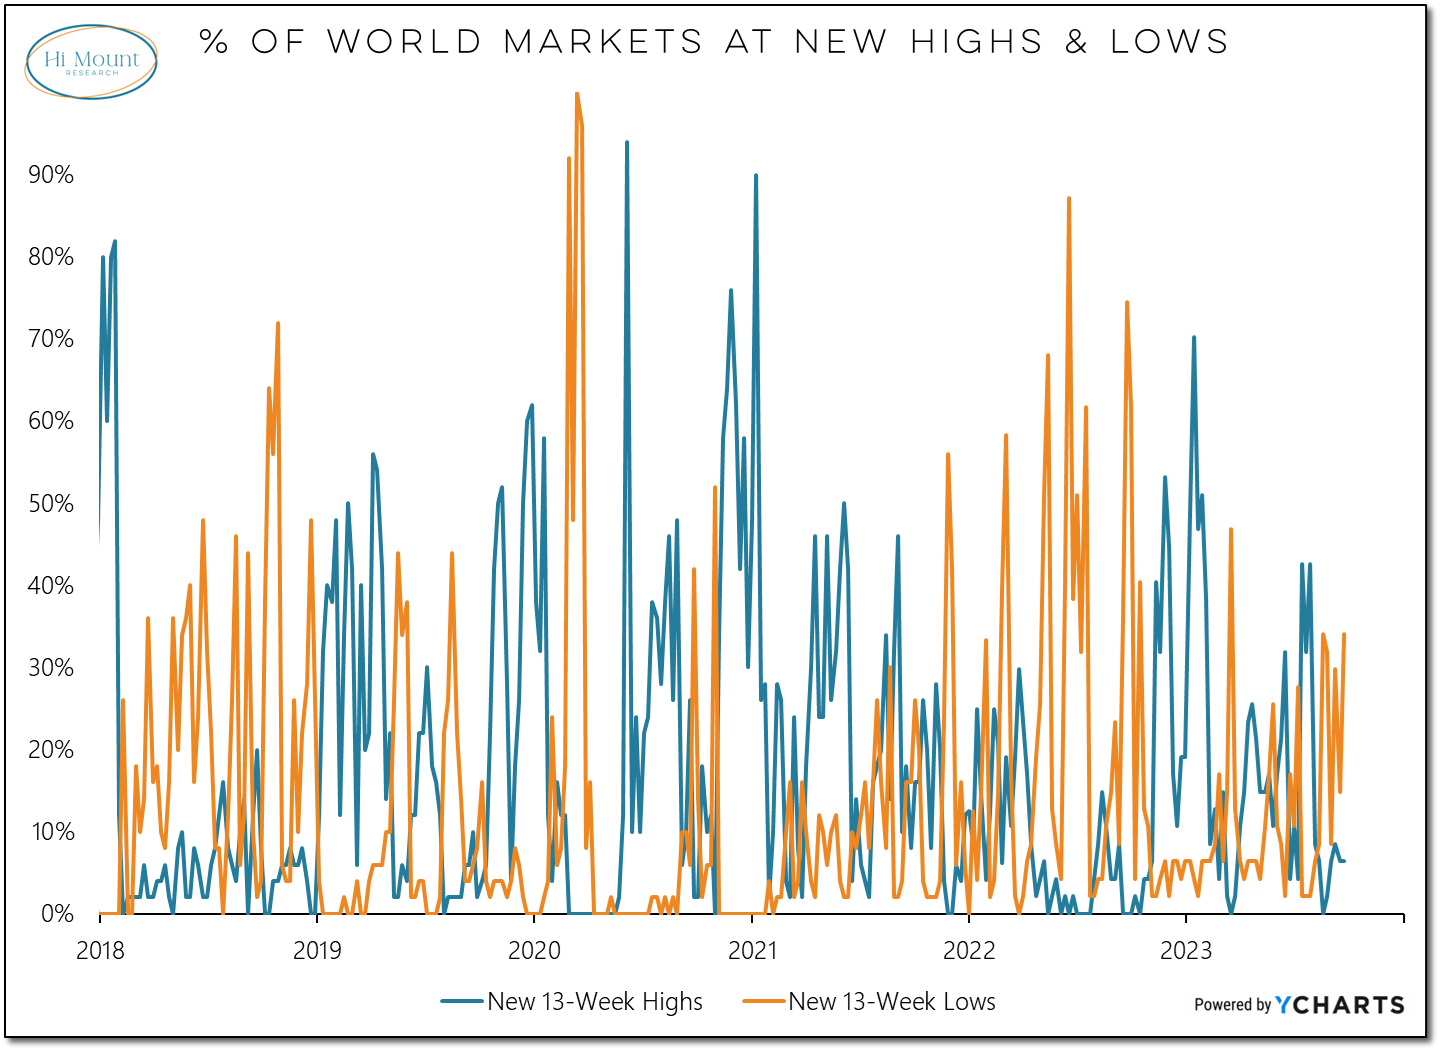
More Context: Nearly two-thirds of the industry groups in the S&P 1500 broke down to new 13-week lows last week. One-third of the world did likewise. From a global perspective, that's the longest new low list since March, while in the US, it's the longest since September 2022 (prior to the most recent low in the S&P 500).
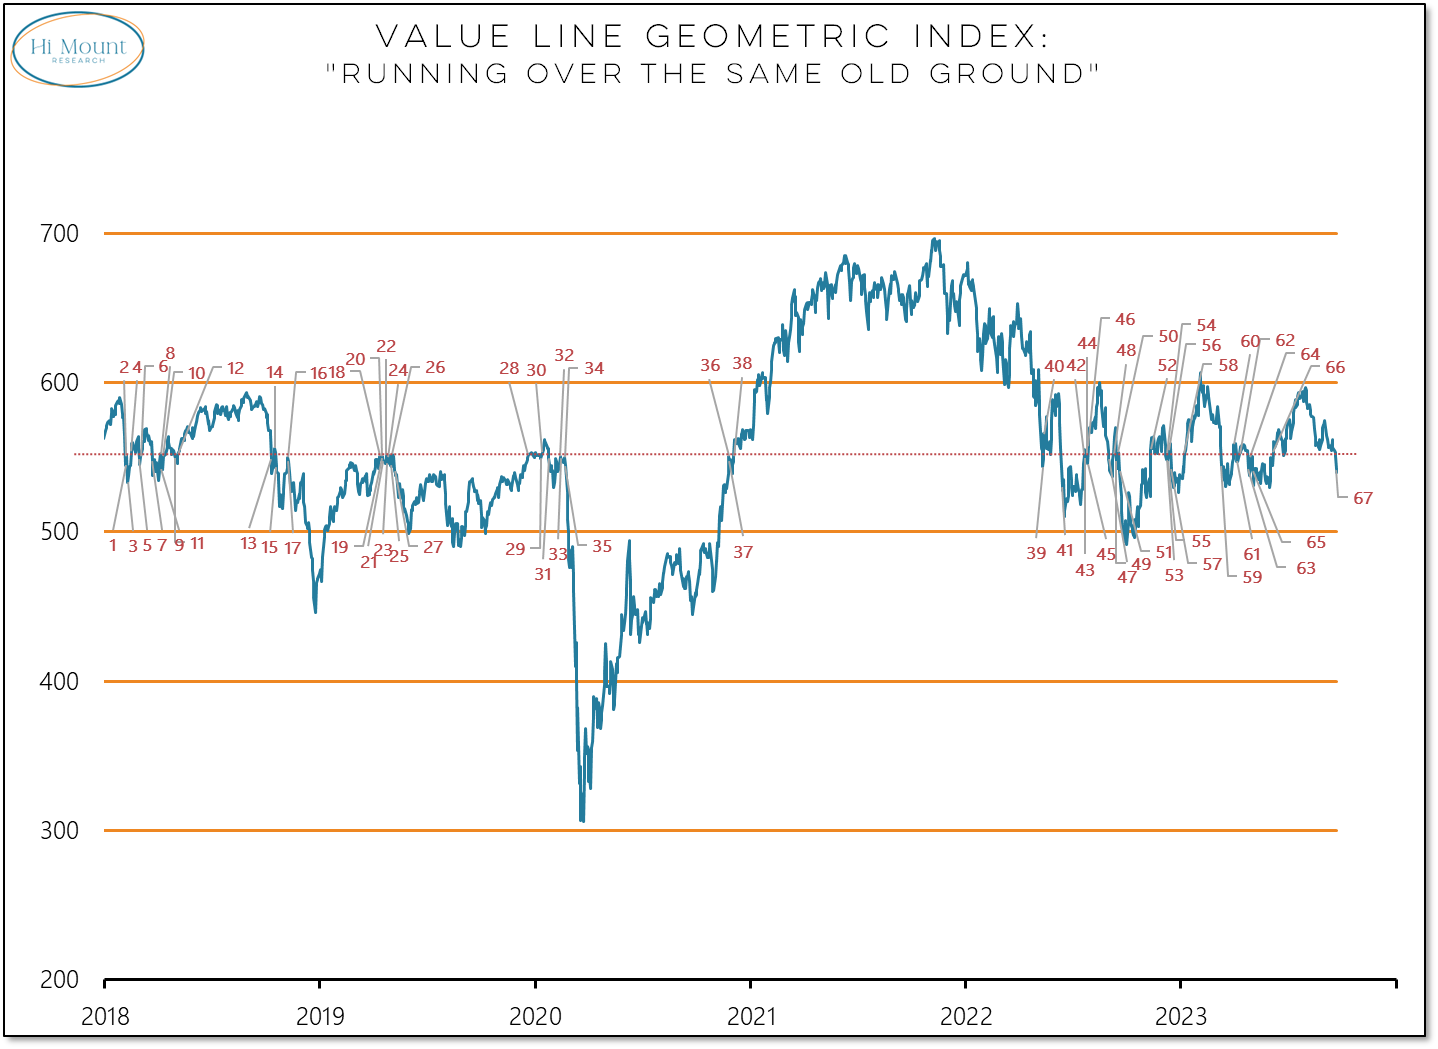
New 52-week lows are expanding at the individual stock level, though at the sector, index and global market level they remain scarce. If bull markets take you to levels you never thought you would see and bear markets take you to levels you never thought you would see again, we probably need a new label for what we are seeing from the Value Line Geometric Index. It's long-term trend has a slight upward bias, but the index crossed the 550 level last week for the 67th time in the past 5+ years. A “Go fishing” market keeps covering the same old ground and the opportunity cost of stepping aside is relatively low.
Our macro-level ETF relative strength rankings show new lows expanding and new leadership from more defensive assets. An expansion in new YTD lows in the final week of third quarter is not typically bull market behavior.
Paid subscribers can keep reading to preview and download our weekly relative strength rankings report, which is also available on our website.
Keep reading with a 7-day free trial
Subscribe to Hi Mount Research to keep reading this post and get 7 days of free access to the full post archives.