New Conversations Are At Hand
Economic Uncertainty is surging & inflation expectations have become unanchored while stocks break down and commodities break out. It's time for investors to adapt to the new paradigm.
Macro Chart of the Week: The first look at March Consumer Sentiment data from the University of Michigan showed a sharp downturn in consumers’ expectations for the economy. As the chart below shows, it also revealed a sharp up-turn in expectations for inflation, both in the year ahead and further out. Long-term inflation expectations have spiked to their highest level in 30 years. The Fed meets this week to discuss interest rates, and while not cut is expected at this week’s meeting, unanchored inflation expectations may give them less flexibility to accommodate the market’s expectations for multiple rate cuts later this year.
Friday’s broad-based bounce produced a 10:1 up-volume day (on very light overall volume) and took some of the sting off of last week’s equity market decline. But the picture for US stocks is still not a pretty one. The Dow Transports made a new 52-week low last week, the S&P mid-cap 400 crossed beneath its late-2021 peak, and the S&P 500 finds itself beneath both its July 2024 high and its 200-day average.
While US stocks are breaking down and struggling with support, other asset classes are breaking out and contending with resistance. Gold crossed about $3,000/oz for the first time ever last week and copper is pushing up to new highs.
Some areas are making new highs and others are making new lows, but overall we are seeing a decisive shift in Risk Appetite that is not at all similar to late 2023.
Then, our Risk On / Risk Off indicator had just made a new high and even during the pullback it stayed in positive (Risk On) territory. In this respect, the current environment is more similar to early 2022 and late 2018. Higher highs for the S&P 500 were accompanied by lower peaks in this indicator followed by a sharp move into negative territory.
Short-term sector-level trends (see the table on page 4 and the chart on page 5 of this week’s Relative Strength Rankings) were about as bad as they could be coming into Friday and even after Friday’s bounce they remain quite negative. In the past this has been a precursor to a meaningful move off the lows. In March 202, strength built on strength and the rally persisted. In June 2022, follow-through was lacking and the rally gave way to new index-level lows. At this point, the burden of proof is on the bulls. That begins with a marked expansion in the number of sectors trading above their 200-day average.
Better breadth action would likely leave investors feeling more hopeful. Rallies that do not produce a big bounce in optimism are more likely to reverse than persist.
For now, we see less and less evidence of bull market behavior.
It’s just a matter of arithmetic, but if the S&P 500 is not able to re-claim its 200-day average, then the 200-day average will (at some point) stop rising. The Bull Behavior Composite has already dropped from 6 to 2, which is the lowest reading since late 2023.
While we have seen sentiment surveys reflect increased pessimism, we have not seen short-term fear spike and the VIX soar. With new lows continuing to outnumber new highs, our Fear or Strength Tactical Model remains in negative territory.
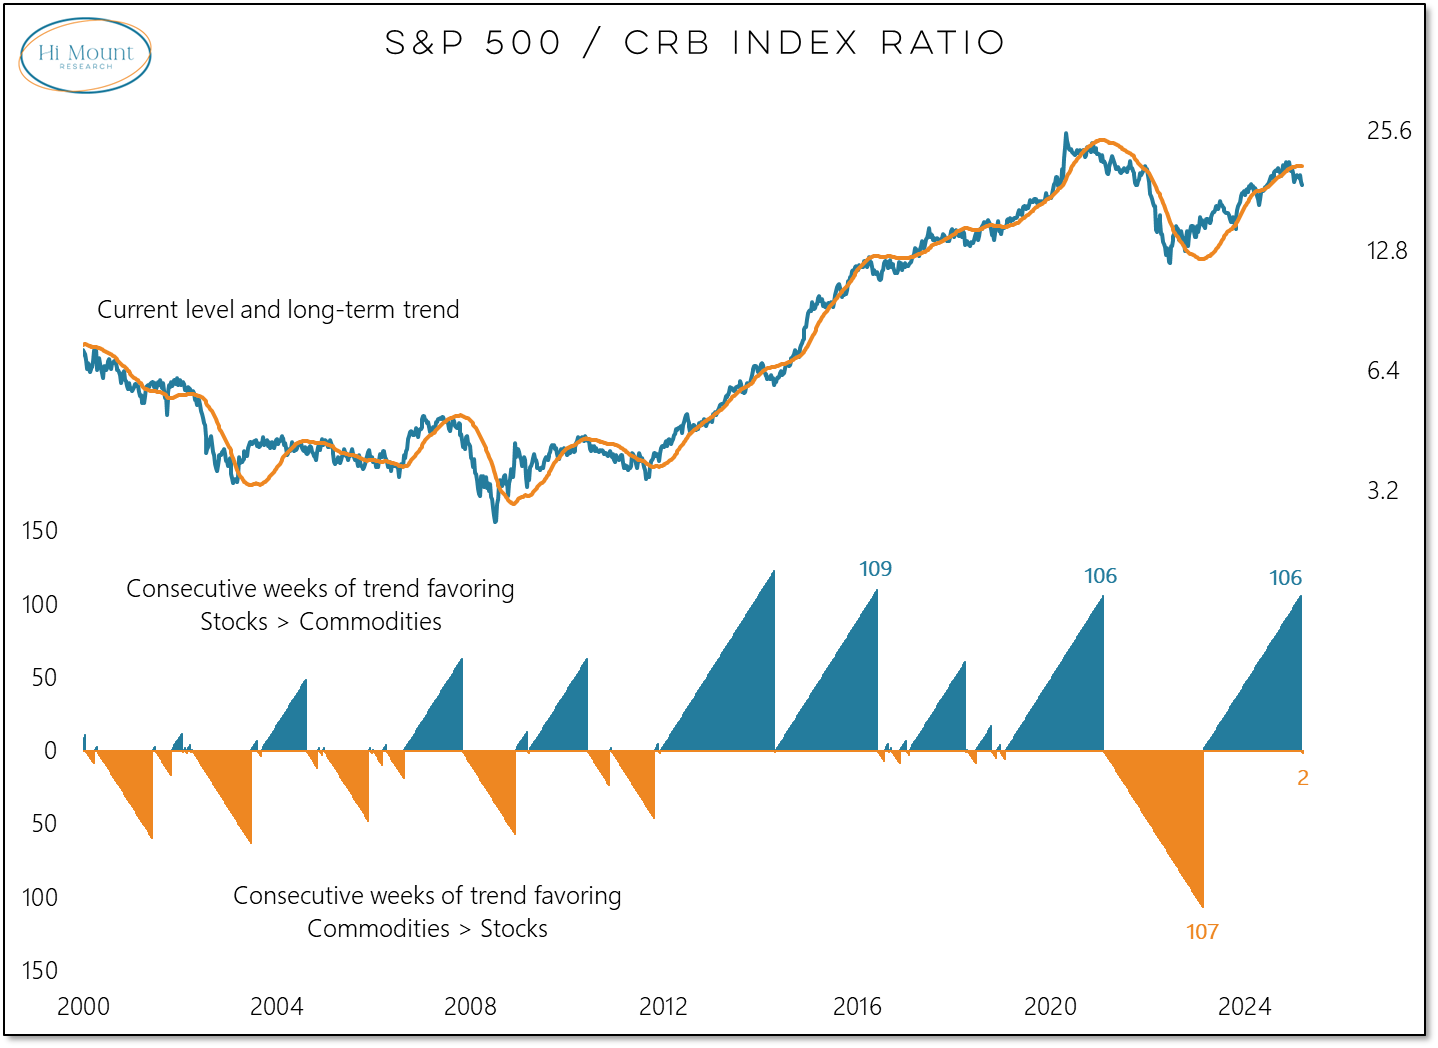
Returning to where we began with stocks breaking down and commodities breaking out, the trend in the ratio between the S&P 500 and the CRB commodities index has turned in favor of commodities after two years of stock market leadership. As strong as stocks have been over the past two years, the stocks/commodities ratio is turning lower without having surpassed its previous peak.
Further evidence of the trend moving away from US stock market leadership comes from the US vs ACWI ex US ratio. Turns toward ex US leadership have emerged periodically over the past decade but have always been short-lived. Time will tell whether this time is different.


