Moving From Bonds To Commodities
Bonds stall, commodities turn higher and stocks look expensive.
Portfolio Applications Update: The monthly update to our Systematic Portfolios is now available. The trend in commodities has turned higher on an absolute basis and relative to bonds. Read the complete update here (or scroll to the bottom to see our current exposure).
Key Takeaway: Commodities turning higher favors continued strength in stocks vs bonds. Stocks have been strong, but the path forward could be rockier than many are positioned for.
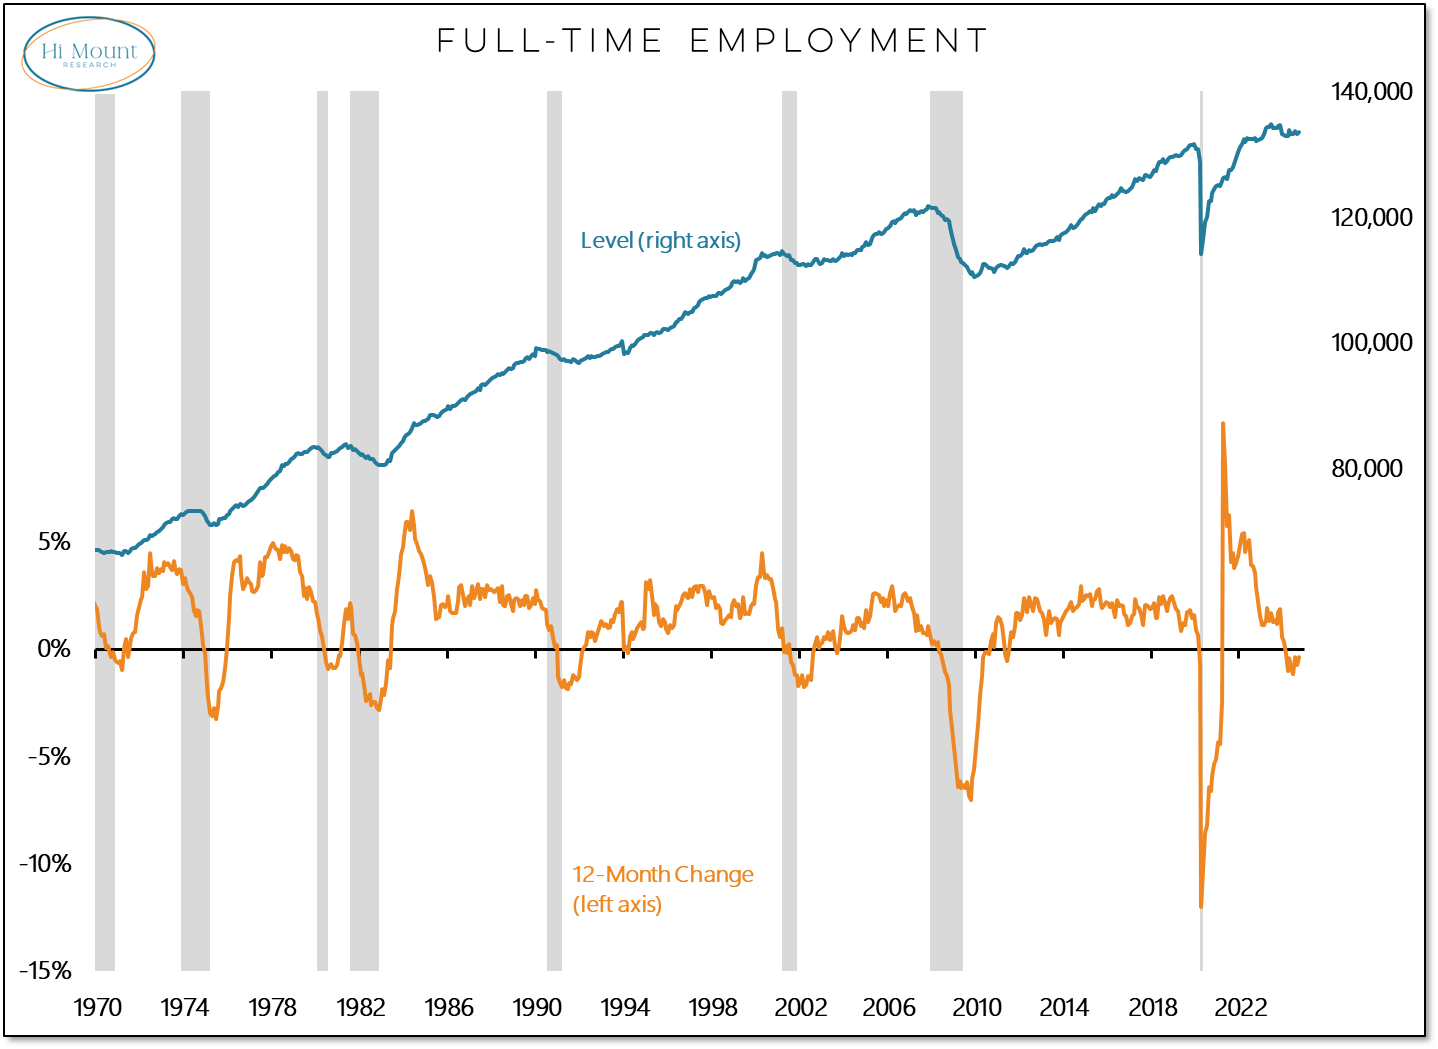
First a comment on Friday’s employment report: Total employment (as measured by the BLS Establishment Survey) continues to rise but full-time employment (as measured by the BLS Household Survey) peaked last summer and is no longer expanding. Yearly declines in full-time employment have always been associated with recessions in the past.
Despite macro-related concerns, stocks have been rallying and breadth has been robust. Our Bull Market Behavior Checklist is firing on most cylinders.
The one flaw on the Bull Market Behavior Checklist is the deterioration in the percentage of ACWI markets above their 50-day averages. Given the global strength that I discussed last week (more than half of the ACWI markets were making new highs), I’d continue to given the bullish case the benefit of the doubt.
Looking further out, the trend in the 200-day average for the S&P 500 continues to rise. When that is the case, stocks are not usually moving lower.
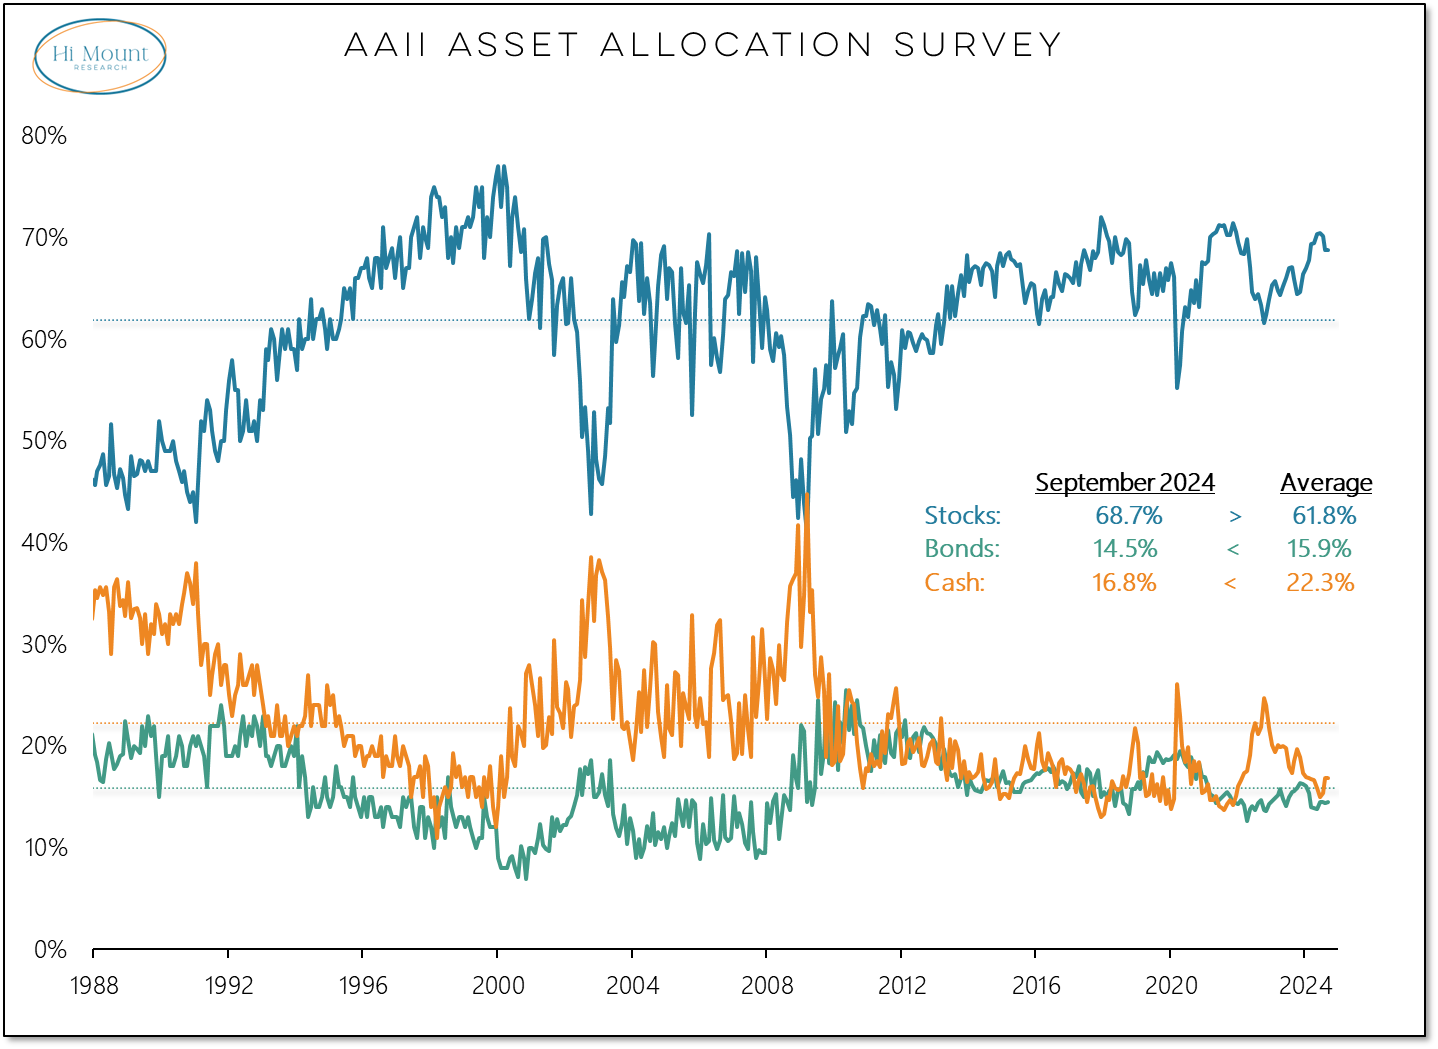
While stocks have been strong, the rally has been fueled by margin expansion (see charts 17 & 18 in the chart pack below). Households have historically high exposure to stocks and there is relatively little cash on the sidelines.
The lack of household liquidity suggests that forward returns for stocks are likely to be muted.
Given the tension between recent strength and longer-term valuation headwinds, the relevant question is whether stocks can sustain their recent break out as earnings revisions break down.
Clients can download the entire annotated weekly chart pack and the update to our Systematic Portfolios.
Keep reading with a 7-day free trial
Subscribe to Hi Mount Research to keep reading this post and get 7 days of free access to the full post archives.


