Investors Not Souring On The Market Despite Stinky Breadth
After 2024 finished with a thud, investors still expect stocks to sparkle in 2025
Portfolio Applications subscriber note: We have published an update to our Blue Heron Systematic Portfolios. From an asset allocation perspective, exposure to commodities has increased and exposure to bonds has been reduced. From an equity sector perspective, exposure to Energy, Materials and Health Care has been reduced as trends in those sectors have rolled over. Exposure has been re-distributed across the 8 other sectors (which remain in up-trends).
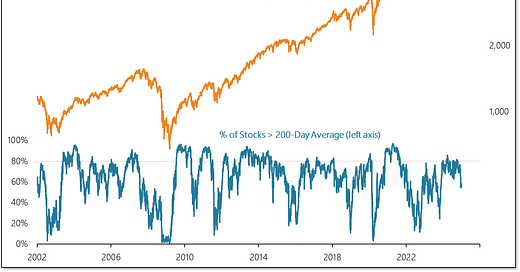
The percentage of S&P 500 stocks above their 200-day average dipped below 60% in December, finishing the 2024 at the lowest level in over a year. Despite persistent strength in index-level trends, it was a struggle to get even 80% of S&P stocks to stay above their 200-day averages.
Breadth deterioration at the stock level is also being seen at the sector level (as well as on a global basis). The number of sectors above their 200-day averages has dropped into a range that has been inconsistent with sustained index-level strength over the past quarter-century.
December finished on a rather inglorious note. Rather than seeing the arrival of Santa, the market finished 2024 with 13 consecutive days of more stocks making new lows than new highs.
This is a rarity under any market conditions, and is all the more exceptional given the index-level strength seen last year.
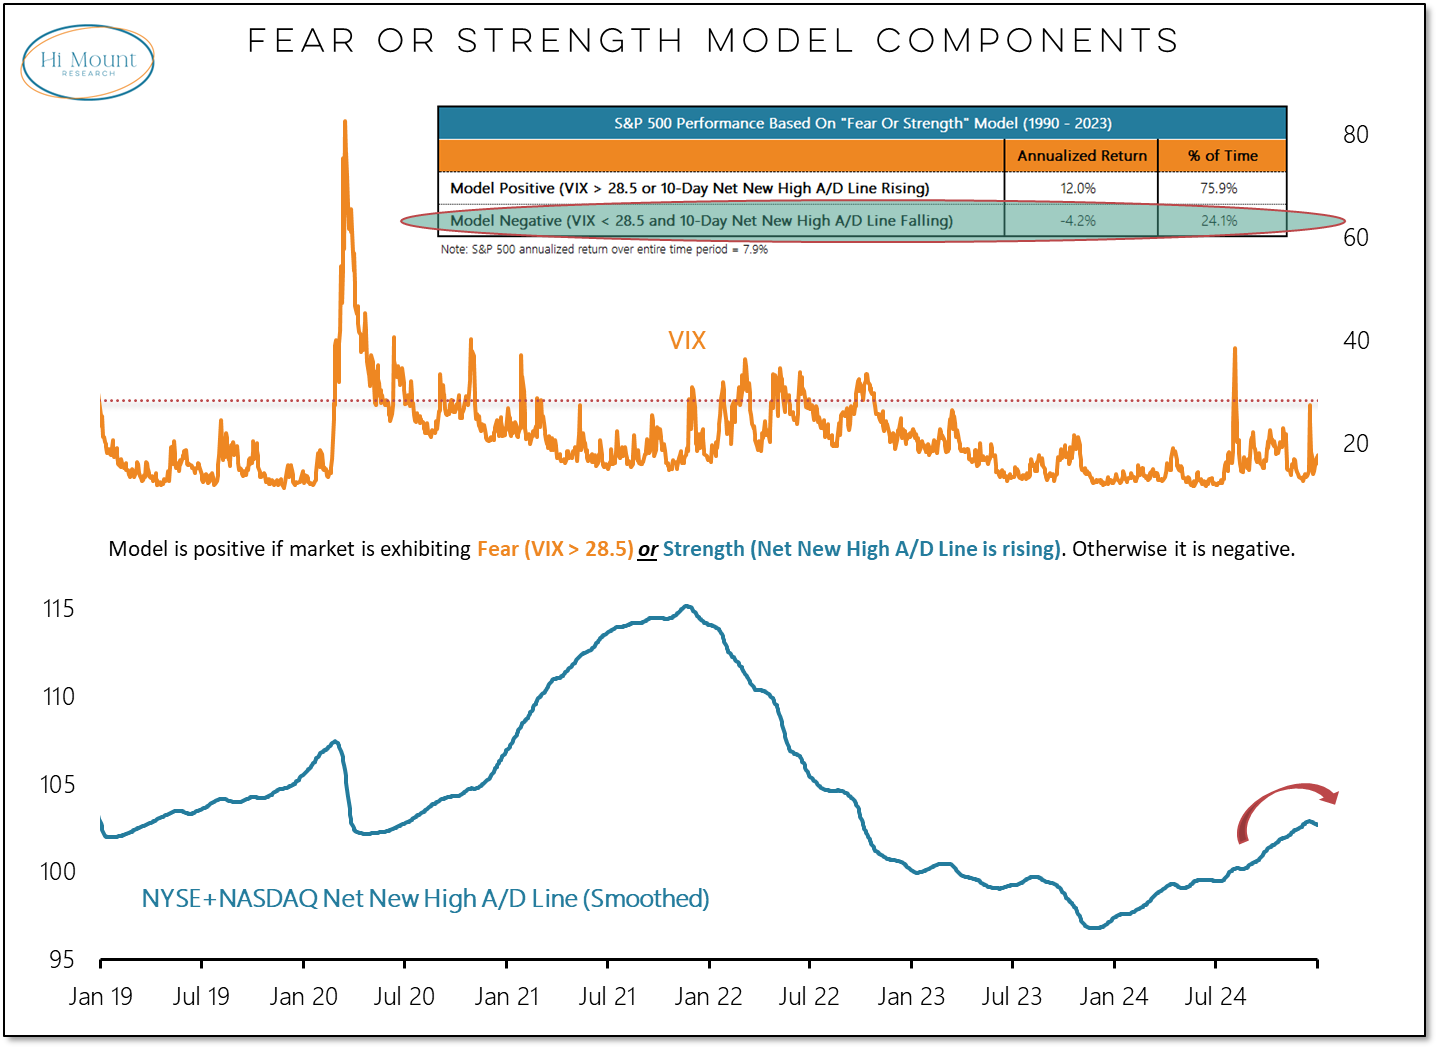
This breadth weakness was sufficient to turn our Fear or Strength model negative.
While breadth deteriorated as 2024 wound to a close, investors remain hopeful on the prospects of 2025. The table above shows that previous instances of sustained year-end breadth weakness were followed by a year of index-level strength.
The December asset allocation data from the AAII shows an increase in equity exposure while investors continue to hold historically low levels of cash (as a percentage of their overall investments).
The weekly AAII sentiment data tells a similar story. For 2024 as a whole, there were only two weeks in which bears outnumbered bulls. The comparable years in the history of this survey were 1995 and 1999. Stock market risks don’t increase becasue optimism is elevated, they increase when optimism turns to pessimism.
To put some numbers on this, all the net gains for the S&P 500 over the past decade have come when the Investors Intelligence Bull-Bear spread has been above 20%. While the spread has narrowed some in recent weeks, it remains above 20% and so sentiment still appears to be a tailwind for stocks. You need to have bulls to have a bull market.
Market Insights subscribers can review the latest from our Bull Market Behavior Checklist.


