Chart(s) of the Day: Another Breadth Thrust?
This is an environment for favoring trend over signal
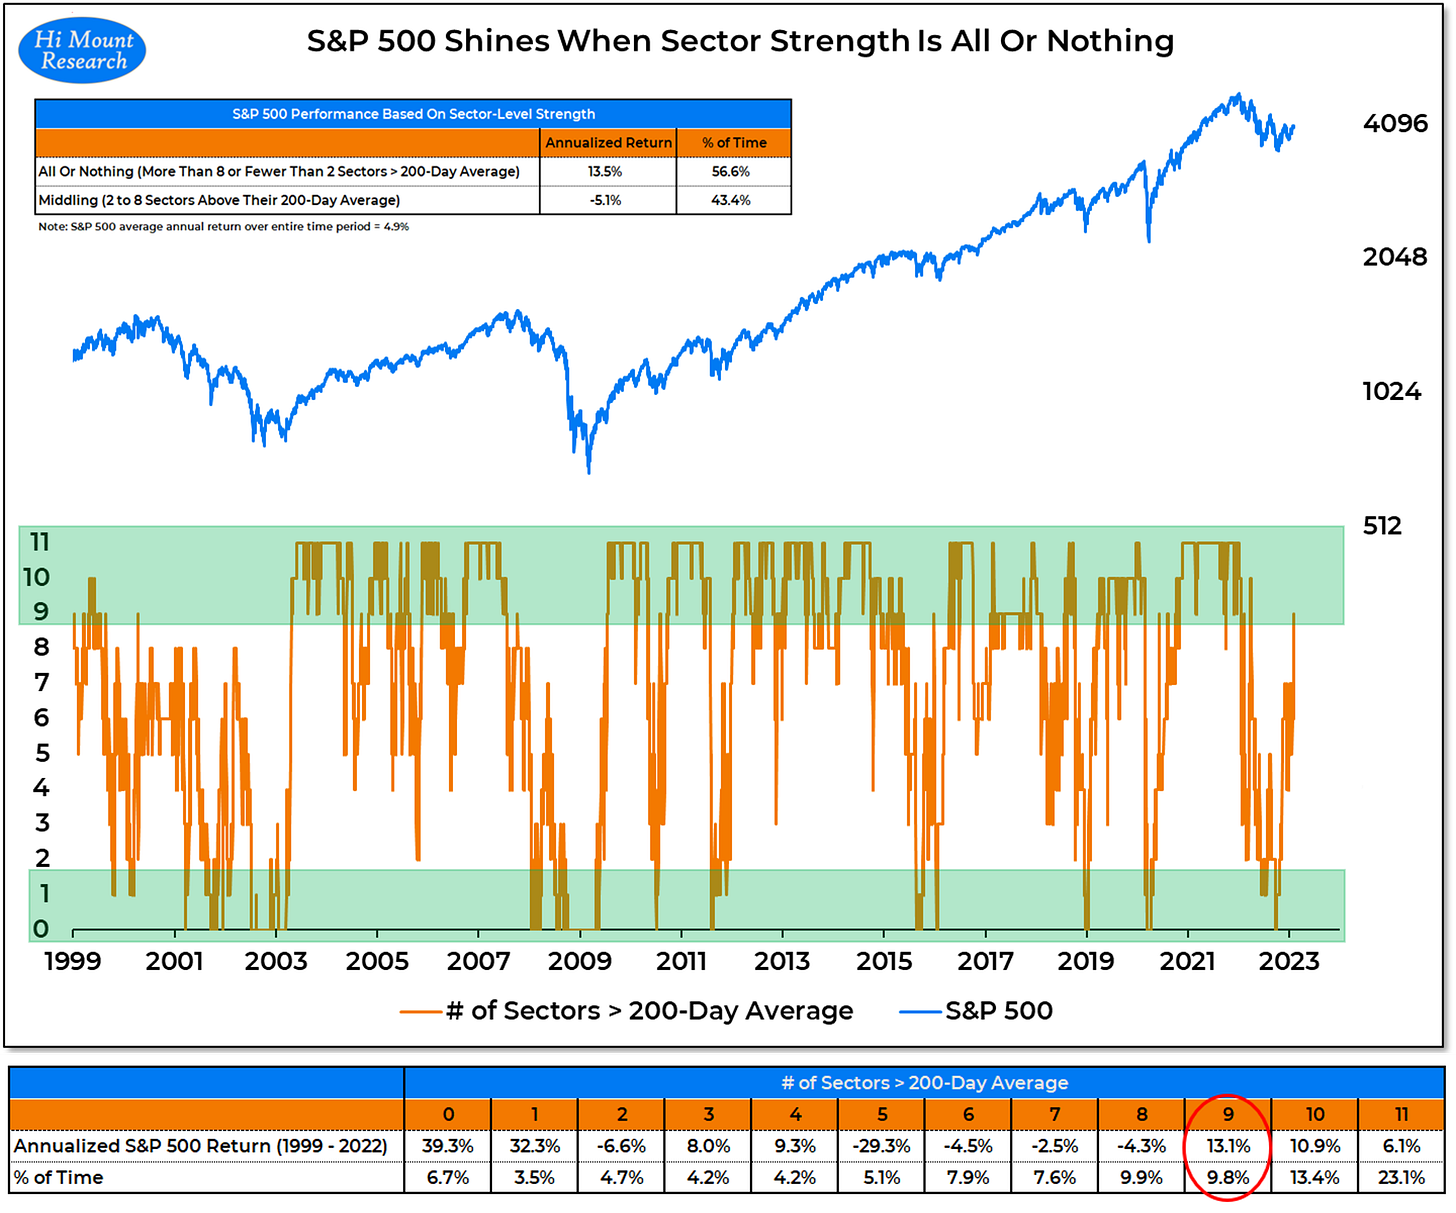
It was 0 for 11 as recently as September, but yesterday finished with 9 S&P 500 sectors above their 200-day average. The 8 previous times over the past 2+ decades that we have gone from 0 to 9 have been signals that relatively good times lie ahead for stocks.
The caveat is that we are awash in indicators that flash in response to a signal event (breadth thrusts, upside volume surges, seasonal barometers). So much so that they threaten to just add noise to an already volatile environment. Numerous breadth thrusts fired over the course of 2022 but there was little evidence of a sustained shift in environment.
Indicators of trend offer a more continuous assessment of the environment. For example, looking at the trend in new highs versus new lows may provide more information about the health of the market than having observed a signal spike in new highs or collapse in new lows.
Returning to the expansion in the number of sectors above their 200-day average. Both the signal and the trend are currently encouraging. But going forward, I’ll be paying more attention to whether that number stays high than the fact that it got high at the end of January. I would rather stay in harmony with the trend that is than the signal that was.


