


Chart from the Day: Volatility Ebbs, So Does Strength
New lows < new highs is NOT bull market behavior

The S&P 500 has gone 7 days in a row without a 1% swing. That matches (for the third time this quarter) the longest such streak since November 2021.
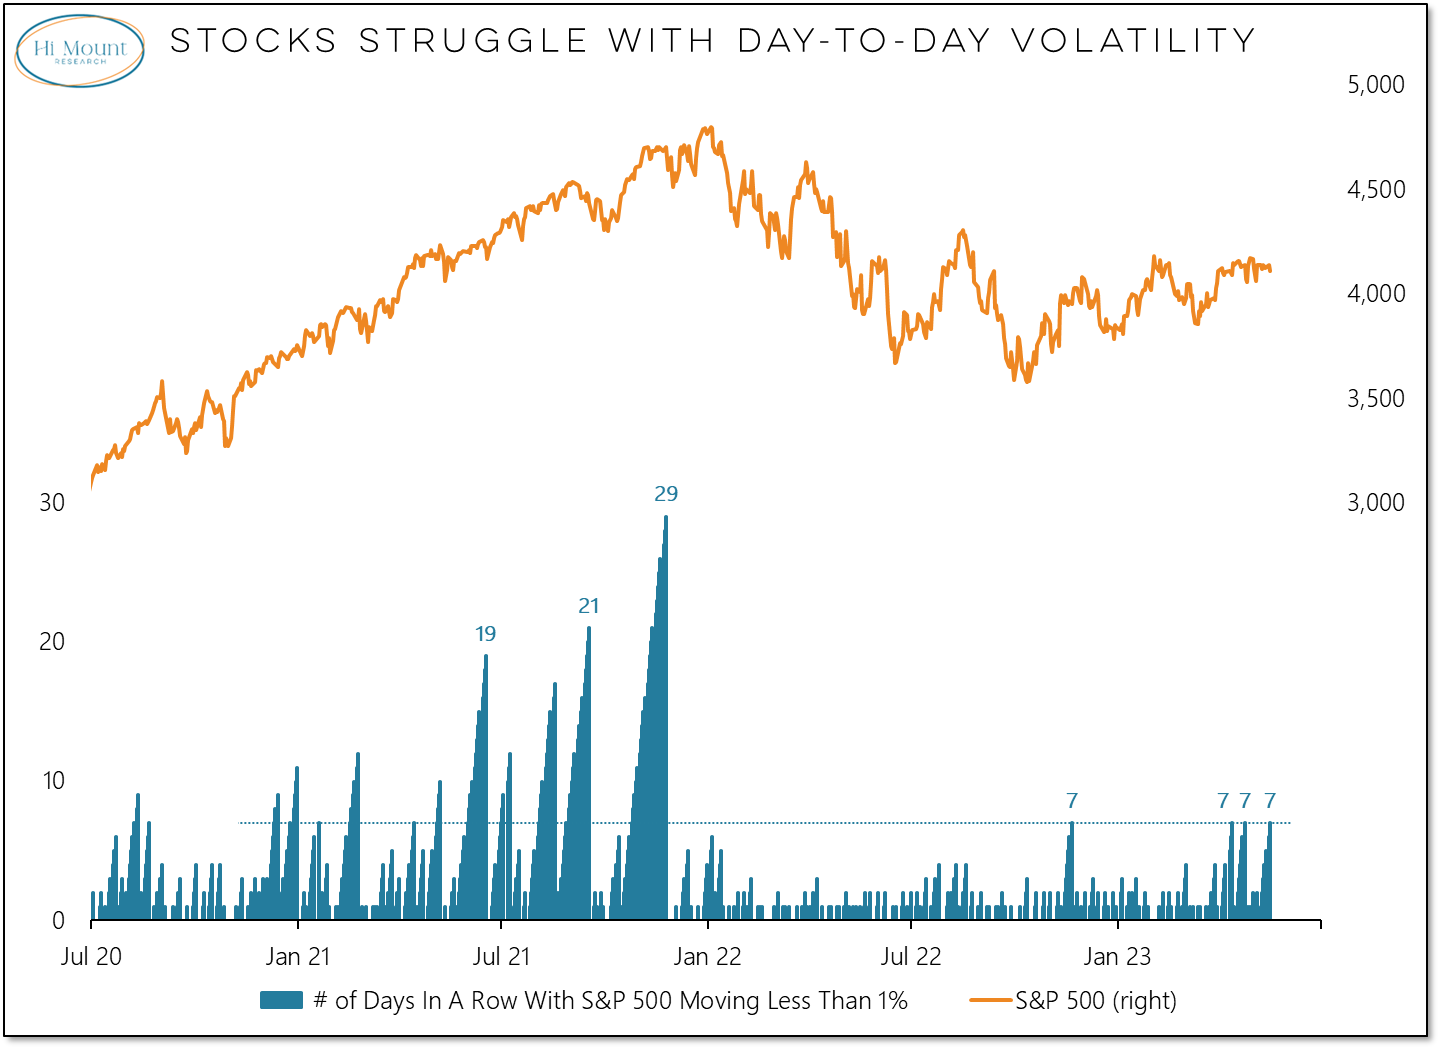
Why It Matters: Over time, volatility and market strength have been inversely correlated. Therefore, an ebbing in day-to-day volatility has typically been evidence of an improving market environment.
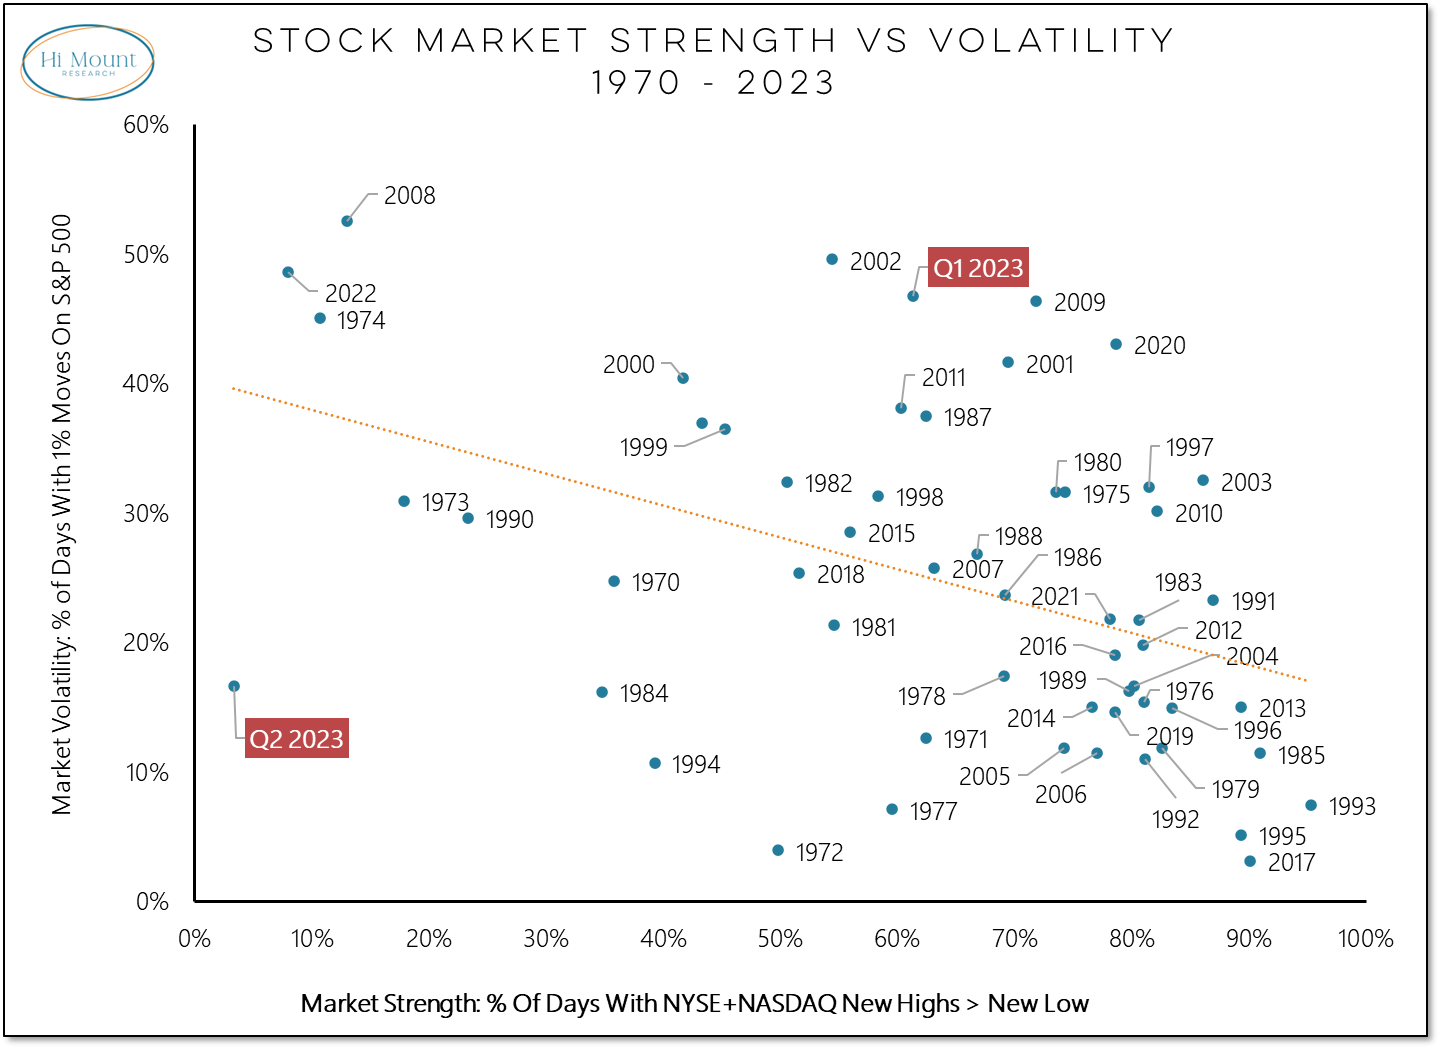
More Context: That inverse relationship has not held in 2023. Q1 experienced elevated levels of both strength (new highs exceeded new lows 61% of the time) and volatility (47% of trading days saw the S&P 500 move by 1% or more). Q2 so far has been the opposite. The percentage of days with 1% swings in the S&P 500 has dropped to 16%. New lows began again to consistently exceed new highs in March and new highs have exceeded new lows on only a single day so far in Q2.
Takeaway: A drop in daily volatility is encouraging, but without an improving tape it may be premature to suggest that we have turned the page from last year’s bear market.