


Portfolio Applications update: The July update to our Systematic Asset Allocation Portfolios has been published (subscribers can click the link for the full report or scroll to the bottom of this email to see a summary of the composite model). The stock/bond ratio continues to recover from its early year swoon. Continued strength is supported by a rising trend in commodities.

Investors are beginning to embrace the recent strength in stocks that has carried most of the world to new highs. Risk appetite has rebounded and last week saw a sharp expansion in optimism. The Investors Intelligence Bull-Bear Spread surged to its highest level since January and is firmly above the 20% threshold. This is an encouraging development. All of the net gains for the S&P 500 over the past decade have come when the bull-bear spread as been above 20%. It takes bulls to have a bull market.

Bull markets also tend to experience extended periods of quiet strength. That too is being seen. We have had seven consecutive days with the S&P 500 moving less than 1% (quiet) and eleven consecutive days with more stocks making new highs than new lows (strength).
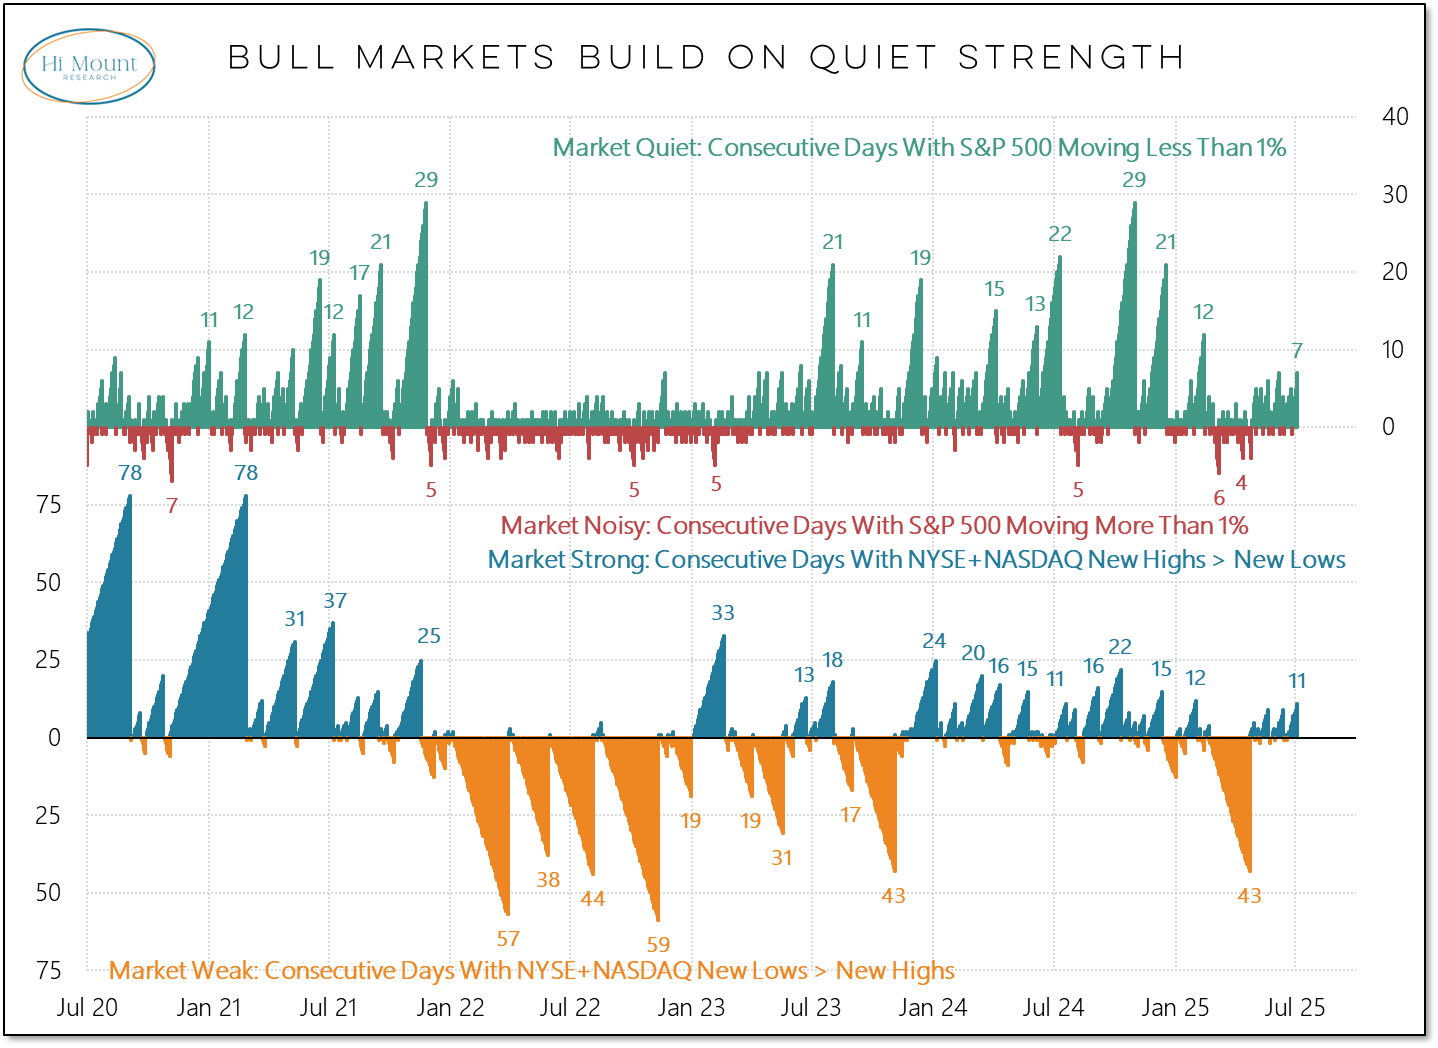
While it may be boring, this is a bull market feature, not a bug.

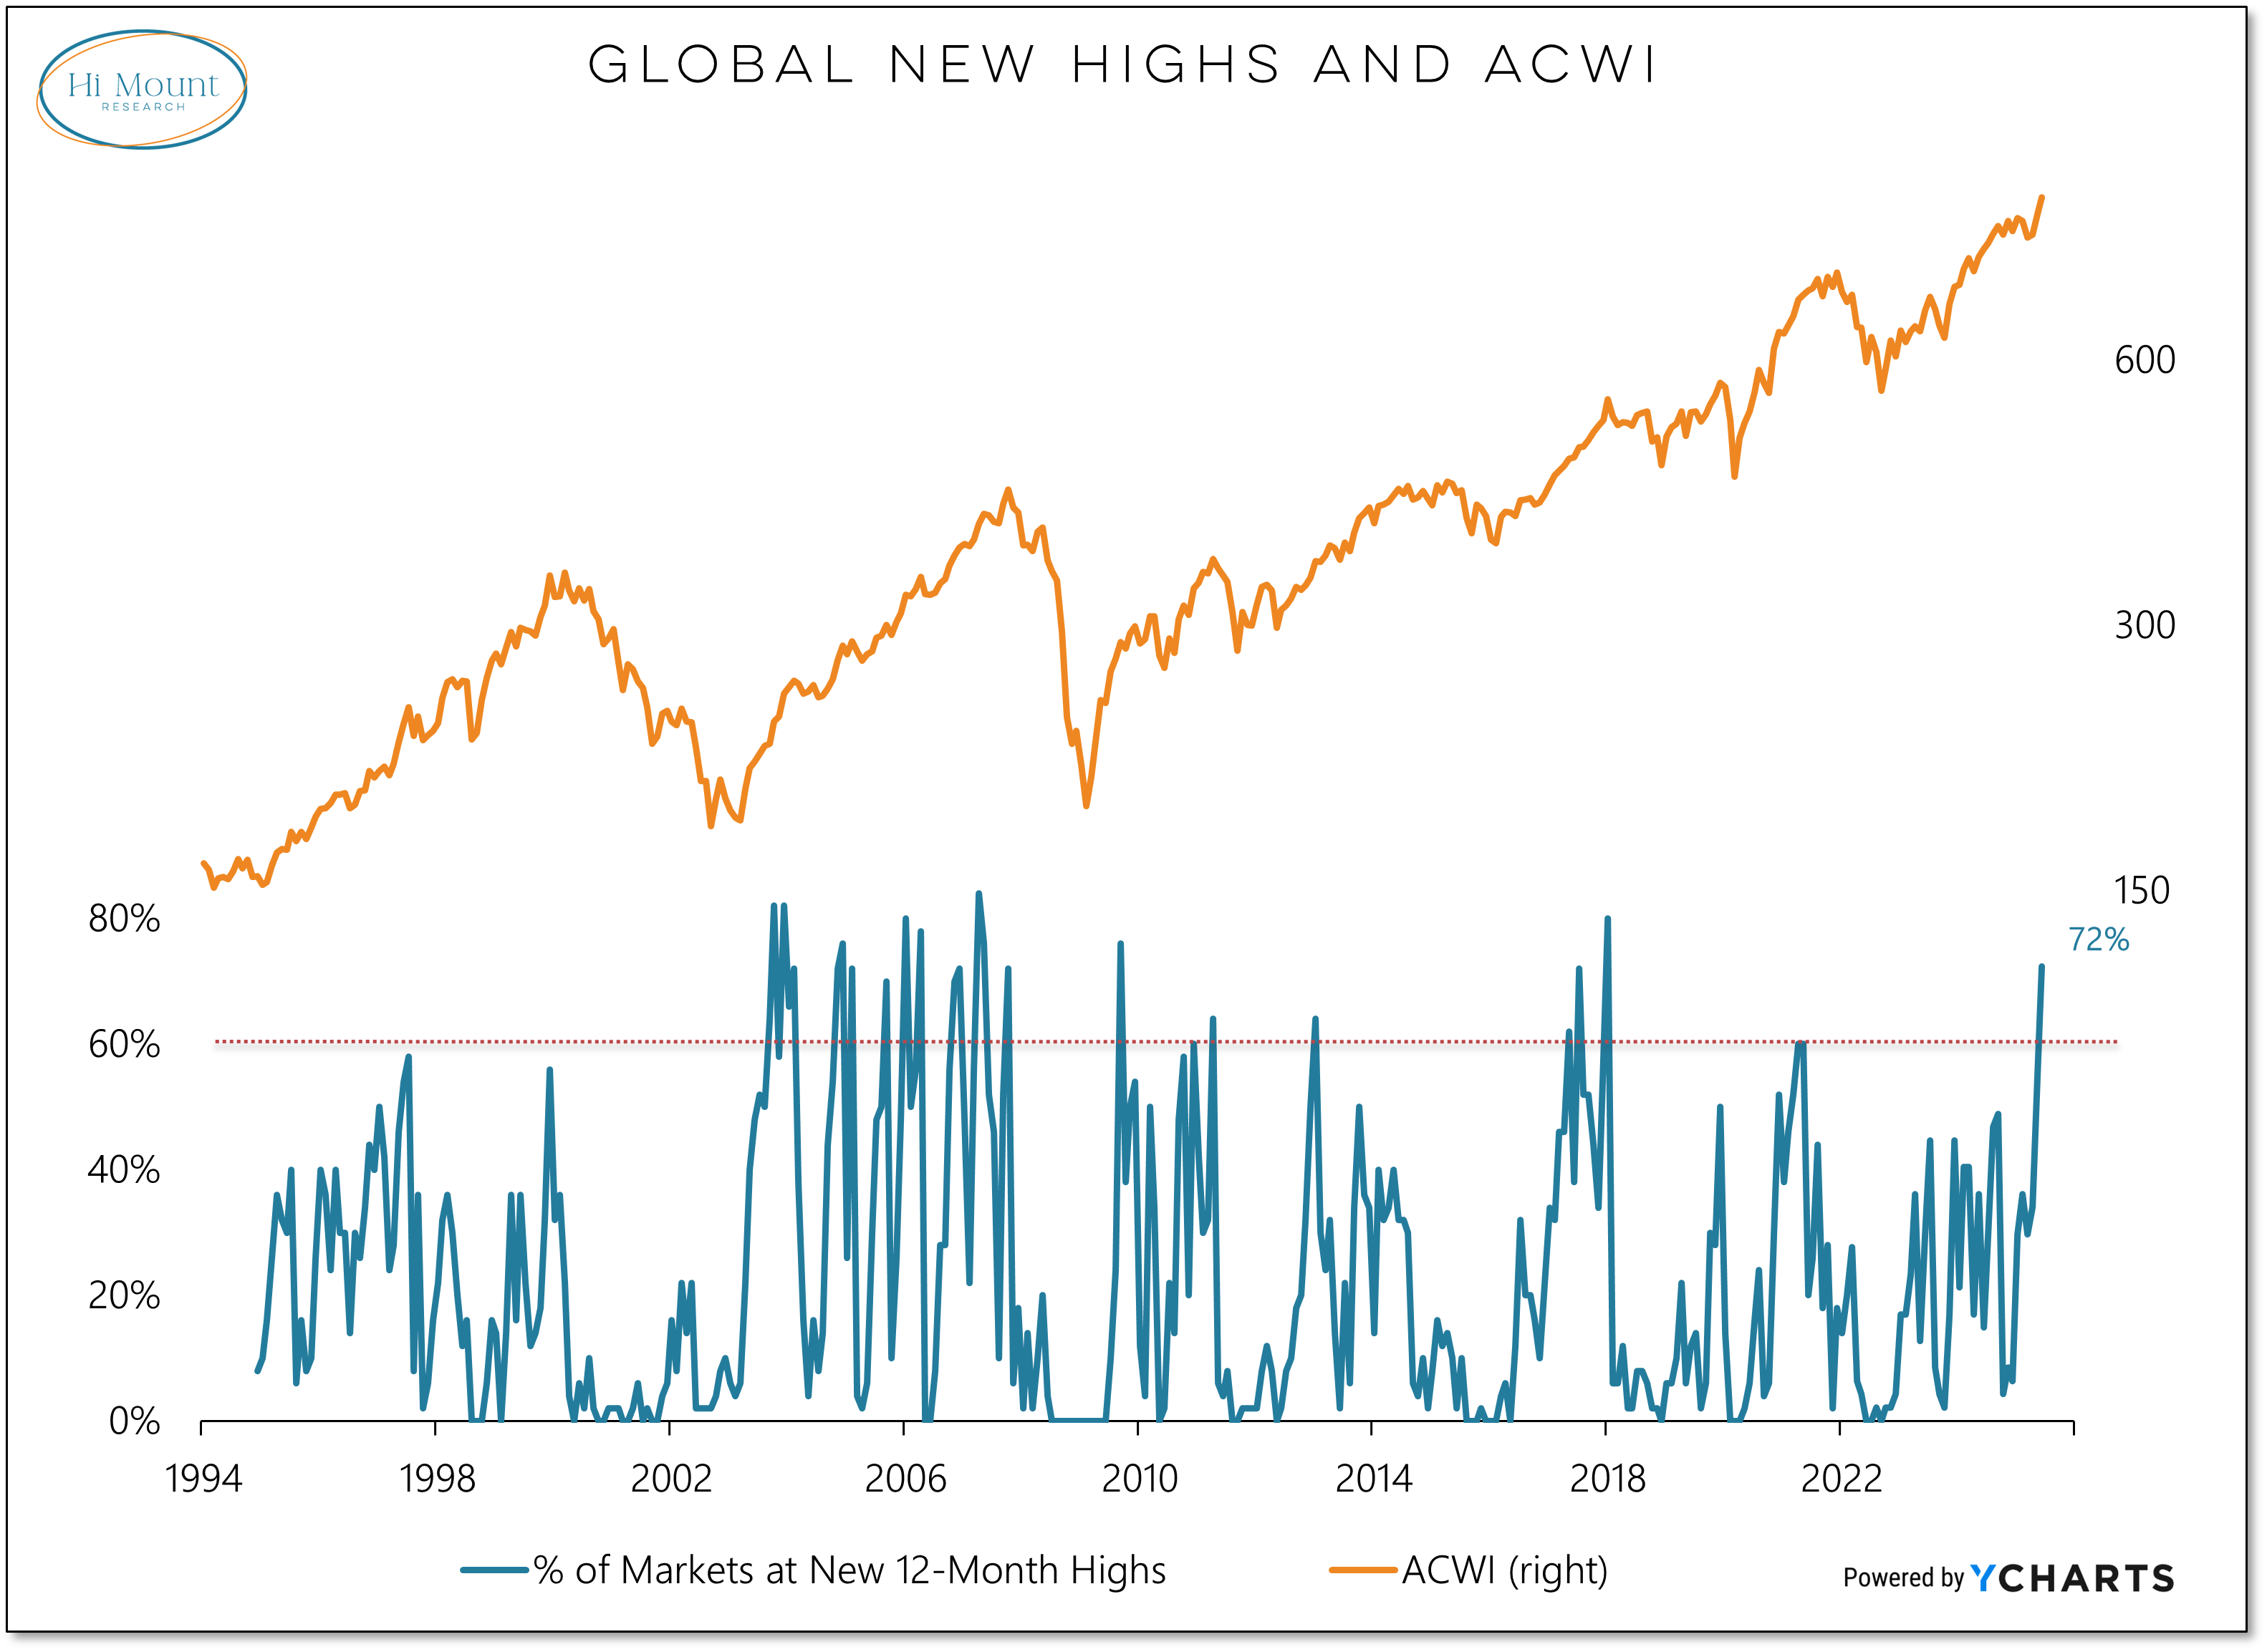
New highs are not just outnumbering new lows, they are expanding. The weekly net new high list is not historically stretched, but the first week of the second half of 2025 featured more net new highs than any week in the first half of 2025.

We have been seeing widespread new highs on a global basis for some time. It is encouraging to see them expand on a domestic basis as well. The percentage of industry groups making new 13-week highs surged to its highest level since late 2023 last week (just a couple of months removed from the April spike in new lows).

Last week also featured a so-called golden-cross for the S&P 500 as the 50-day average climbed above the 200-day average. Whether it is a golden cross or a death-cross (when the 50-day moves below the 200-day), the crossing itself does not matter as much as the condition it creates. All of the net gains for the S&P 500 over the past quarter century have come when the 50-day average has been above the 200-day average.
While this trend improvement has been recorded at the index level, most stocks within the index (and an even larger percentage of of small-cap and mid-cap stocks) still have 50-day averages that are below their 200-day averages. The percentages are improving, but there is plenty of room for the average stock to play catch-up.

Keep reading with a 7-day free trial
Subscribe to Hi Mount Research to keep reading this post and get 7 days of free access to the full post archives.