Bull Markets Build On Quiet Strength
The Tape has been slow to turn but overall market conditions are improving
If you need a break from football, turkey or family over the next few days, download and flip through our latest annotated chart pack and relative strength rankings.
If you like what you see and would like to have ongoing access to our insights and models, drop me a note and we can discuss subscription options.
Key Takeaway: The best evidence of a sustainable rally would be an extended period of quiet accompanied by an extended period of strength. Bull markets are as boring as they are resilient.
Our checklist is improving as the long-term trend in the Value Line Geometric Index turned higher last week and the percentage of global markets above their 50-day average has climbed above 70% (currently at a new YTD high). Both of these developments are consistent with bull markets of the past.
The tape, however, has been slower to turn. The now 15 weeks in a row of New Lows > New Highs is tied for the third longest such stretch since the 2008-09 Financial Crisis. Over the past two years (104 weeks), new highs have exceeded new lows a total of only 18 times.
The trend in net new highs has continued to fall even as the the long-term trend in the S&P 500 turned higher (back in May). These two series have tended to move together over time, so this divergence is notable for both its degree and duration.
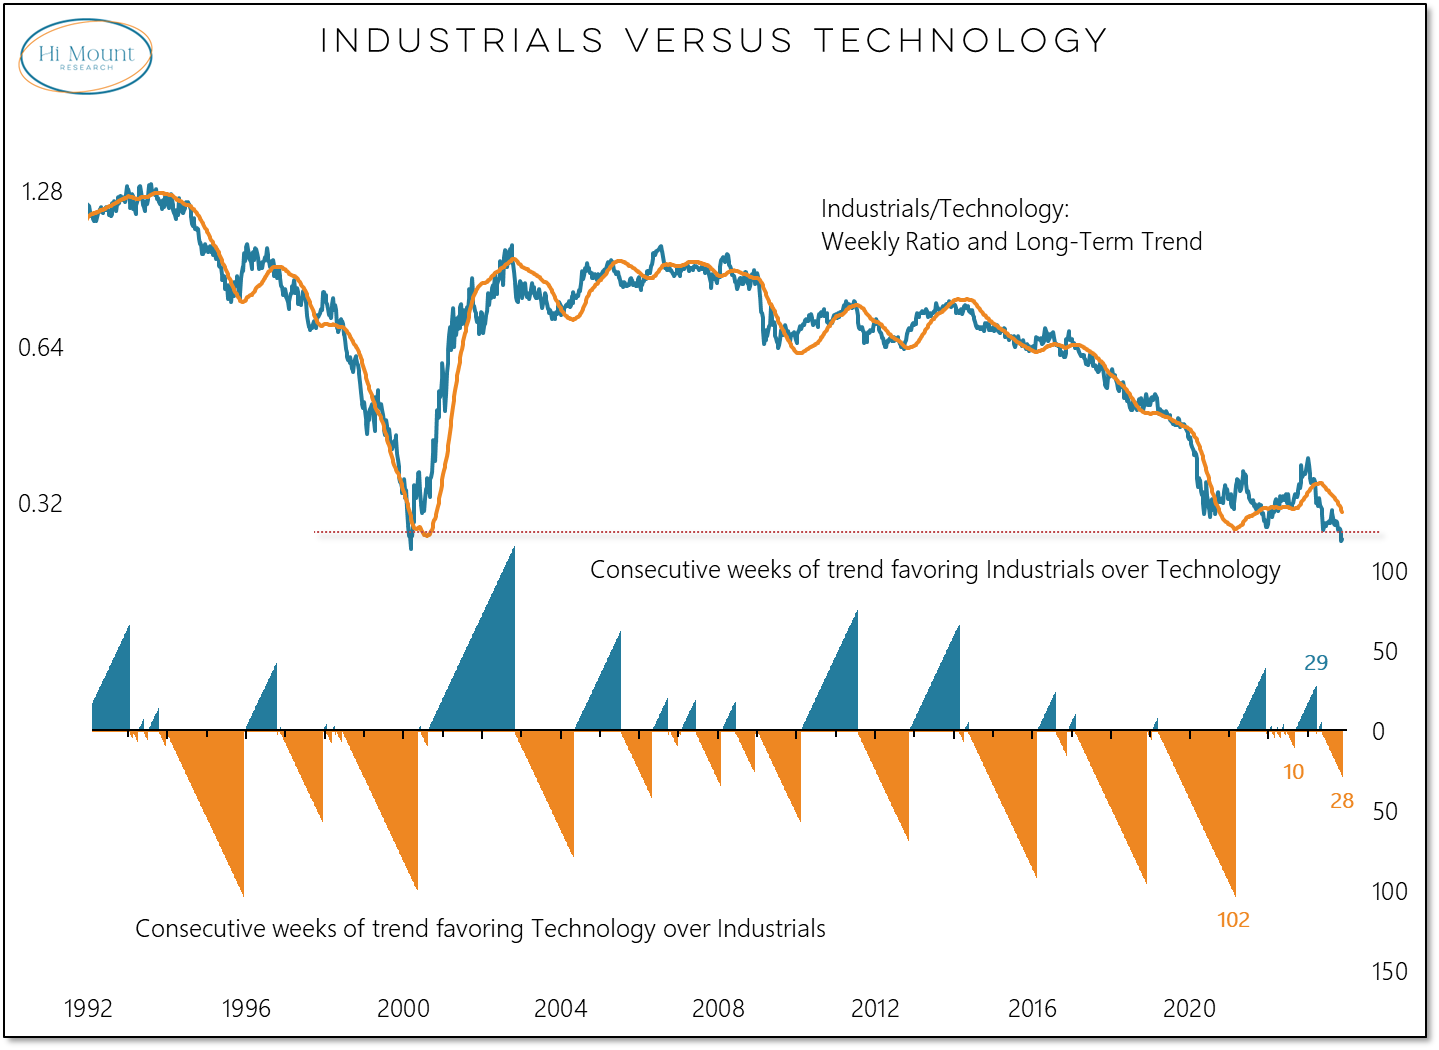
Another way to view this divergence is through the lens of the ratio between Industrials and Technology. Industrials/Technology ratio is back to a level seen only during the Tech bubble.
Technology ($XLK) is the most top heavy sector, with the top 5 stocks making up 60% of the weighting (AAPL and MSFT combined are nearly 50%). Industrials ($XLI) is the most diffuse sector, with the top five stocks only accounting for 20% of the weighting.


